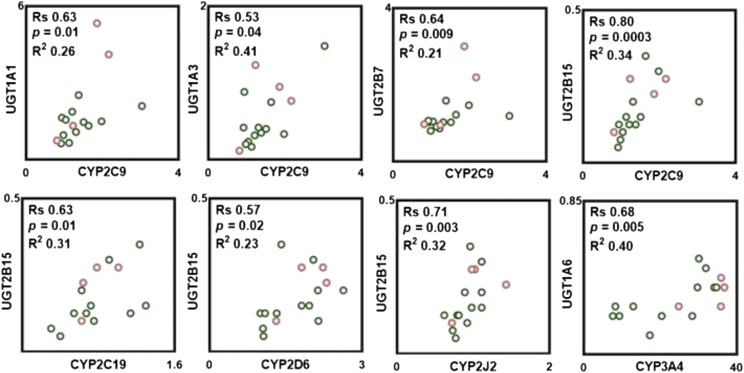
Fig. 4.
Observed correlations in protein abundances between P450 and UGT enzymes. Correlation analysis was performed using Spearman rank-order correlation (Rs) test with t-distribution of the P value. Linear regression analysis was carried out to assess the linearity of relationships and scatter of the data (R2). Correlations were deemed strong when the Rs values were greater than 0.60, P values were less than 0.05, and the data points demonstrated limited scatter (R2 > 0.30). Rs values between 0.5 and 0.6 with a P value less than 0.05 were considered to represent moderate correlation. Clear circles with a green border correspond to protein abundance in the ileum, and clear circles with a red border correspond to protein abundance in the jejunum.

