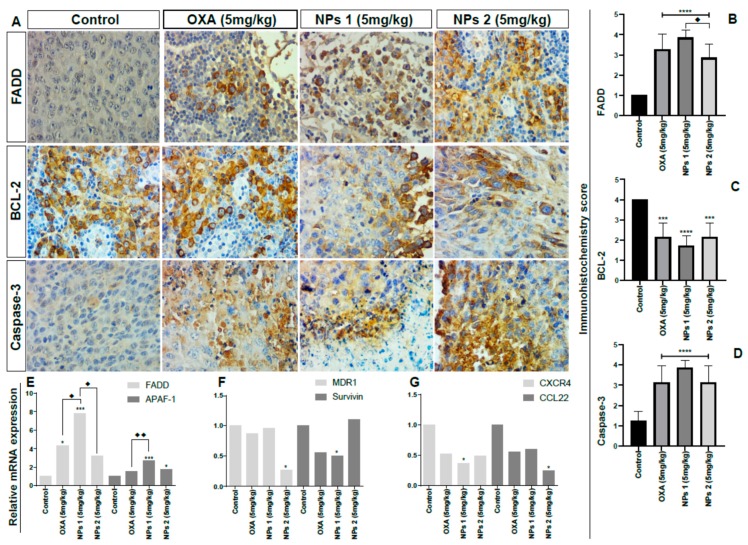
Figure 7.
Analysis of apoptosis, drug resistance, and metastasis factors. Representative photomicrographs of immunohistochemistry of tumor fragments of mice receiving different treatments (A). Immunohistochemistry score by anti-FADD (B), anti-BCL-2 (C), anti-caspase-3 (D), relative messenger ribonucleic acids (mRNA) expression by RT-PCR for FADD and apoptotic protease activating factor 1 (APAF -1) (E), multidrug resistance protein 1 (MDR1) and survivin (F), and C-X-C chemokine receptor type 4 (CXCR4), and monocyte-derived chemokine (CCL22) (G). All treatment groups were compared to the negative control group (**** p < 0.0001). Comparison between OXA (5 mg/kg) and NPs 1 (5 mg/kg, ♦ p < 0.05) as well as between OXA (5 mg/kg) and NPs 2 (5 mg/kg, ♦♦ p < 0.01) was also performed (p < 0.0001 for both). Magnification: 40×.

