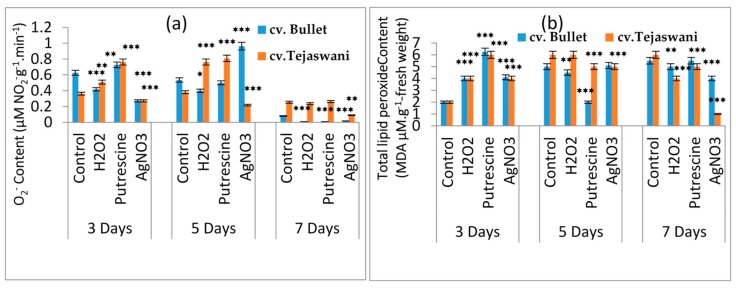
Figure 4.
Changes of total O2-content (a)and total lipid peroxide content (b) of two chili types, i.e., cv. Bullet and cv. Tejaswani, under different treatments (control, H2O2, putrescine, and AgNO3) and durations (3, 5, and 7 days). The vertical bars represent the data with means of three replicates with ± SE (n = 3) from the individual set of experiments, and significant differences between treatments as calculated by student’s t-test marked as *(p ≤ 0.05) ** (p ≤ 0.01) *** (p ≤ 0.001).

