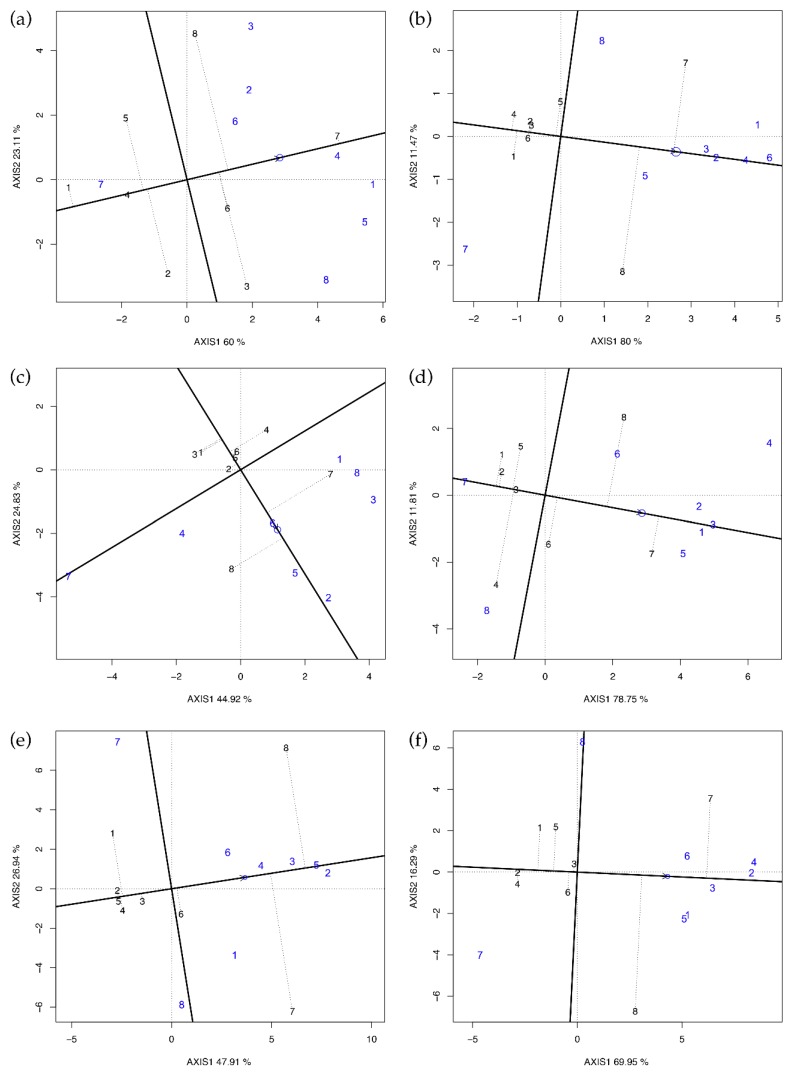
Figure 1.
GGE biplot for yield per plant in every single environment. (a) Latina 2014, (b) Perugia 2014, (c) Latina 2015, (d) Perugia 2015, (e) Latina 2016, and (f) Perugia 2016. Parents used as entries/testers are indicated with black/blue numbers (1 = Vedrantais; 2 = Ita1; 3 = Ogen; 4 = Top Mark; 5 = Magyar Kincs; 6 = Hale’s Best Jumbo; 7 = PI414723; 8 = PI161375). Entries GCA effects are approximated by their projections on the average tester coordinates (ATC) abscissa indicated by the arrow. SCA effects are orthogonal to GCA; therefore, the projections of the entries onto ordinates of ATC must approximate their SCA effects with all the testers. If entries and testers are on the same side of the ATC abscissa, their interaction is positive, and it is negative otherwise.

