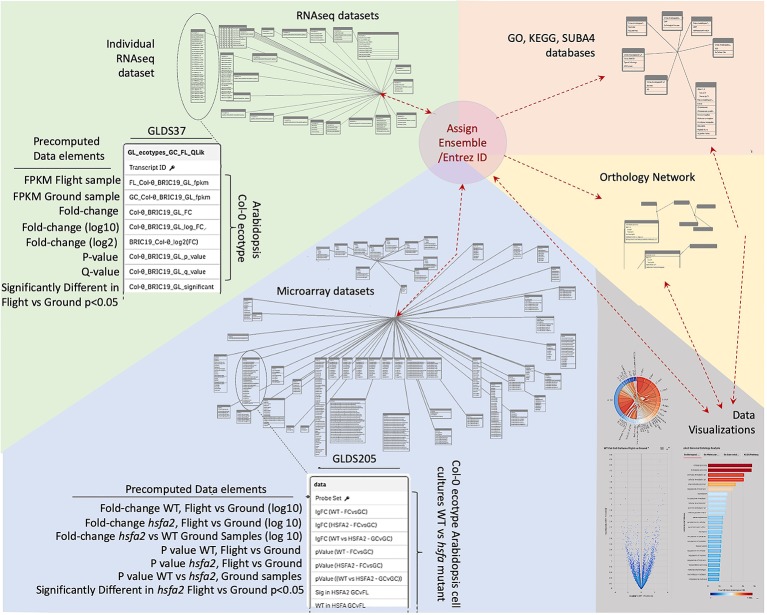
Figure 2.
Database structure underlying TOAST 4.5. Each dataset within TOAST includes a series of pre-computed factors for each gene: minimally including fold-change, P-value, Q-value, and a yes/no value for whether the fold-change for each gene is significant at P < 0.05. These pre-computed values greatly speed the real-time processing of interactive visualizations within the TOAST user interface. The identifiers in the raw data, such as Transcript ID from RNAseq, Probe ID for Microarray, or TAIR ID are translated to their unique Entrez and Ensembl IDs to allow for uniform indexing within TOAST itself and to facilitate passing of analyzed data produced by TOAST analyses to exterior sites and tools. Within TOAST, the strings of molecular ID's from a dataset are both directly transferred to a series of data visualization and exploration tools and are imported into a series of analytical packages accessing a range of databases that have been imported into the TOAST environment. These databases include: the Genome Ontology (GO) consortium databases that allow analysis of the relationships between gene lists of interest and known biological processes, the SUBA4 database which catalogs predicted subcellular locales for each gene, the Kyoto Encyclopedia of Genes and Genomes (KEGG) database that analyzes relationships to known cellular pathways, and Ensembl's Orthologous Matrix database, allowing TOAST to make comparisons between species. The outputs of these analytical modules are then passed to TOAST's interactive data visualization tools to help explore each dataset. Results from the visualizations are in turn returned as lists of Gene IDs to allow for reiterative analyses.

