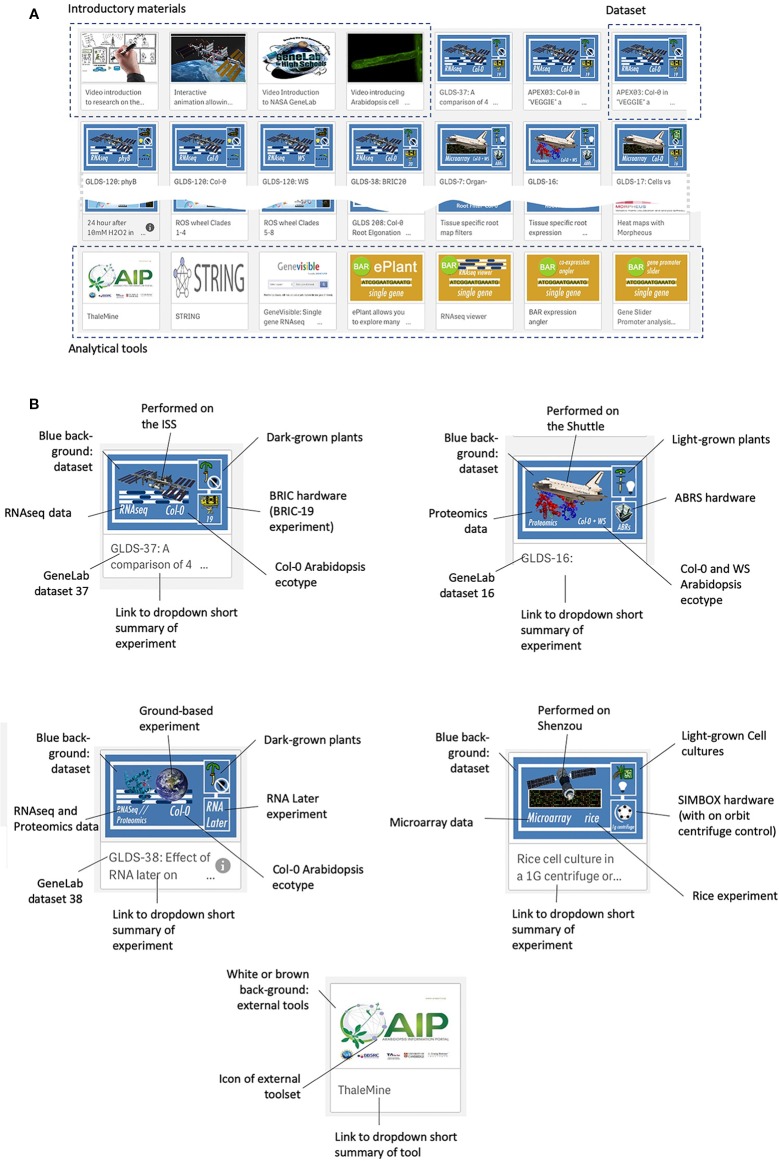
Figure 3.
The TOAST 4.5 user interface. (A) The web interface for TOAST launches an overview menu of dashboard icons allowing the user to directly access the introductory materials, omics data, and related analysis tools. (B) Each icon provides a visual summary of the data or tools that it links to including elements such as spaceflight vehicle (e.g., Shuttle, ISS, Shenzou vs ground-based experimentation), the growth hardware used, plant/seedling vs cell culture experiment, RNAseq vs microarray vs proteomics, species and ecotype and dataset identifier (e.g., GLDS number).

