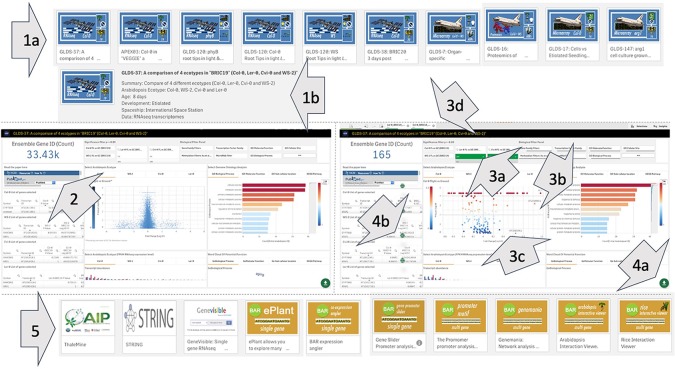
Figure 5.
Overview of use of the TOAST 4.5 database. (1a) The user selects an initial study of interest and then can review the summary of its metadata to ensure it is the correct focus for study (1b). The dataset is then opened and (2) when the study is selected an interactive dashboard launches and the user has a direct link to any associated manuscript. Gene filtering: statistical (3a), gene ontology (3b), and other related functional filters can be applied to focus the number of loci being visualized in the volcano plot (3c) to genes of interest. In addition, the volcano plot itself can be interactively manually filtered using a graphical selection tool. All filters can be toggled on and off using selectable tabs at the top of the interface (3d). If an interesting subset of loci are selected the user can activate the download option (4a) and save the related data in word or xml format (4b). (5) The user can also perform further bioinformatic and statistical analysis with other online tools linked from the main user interface.

