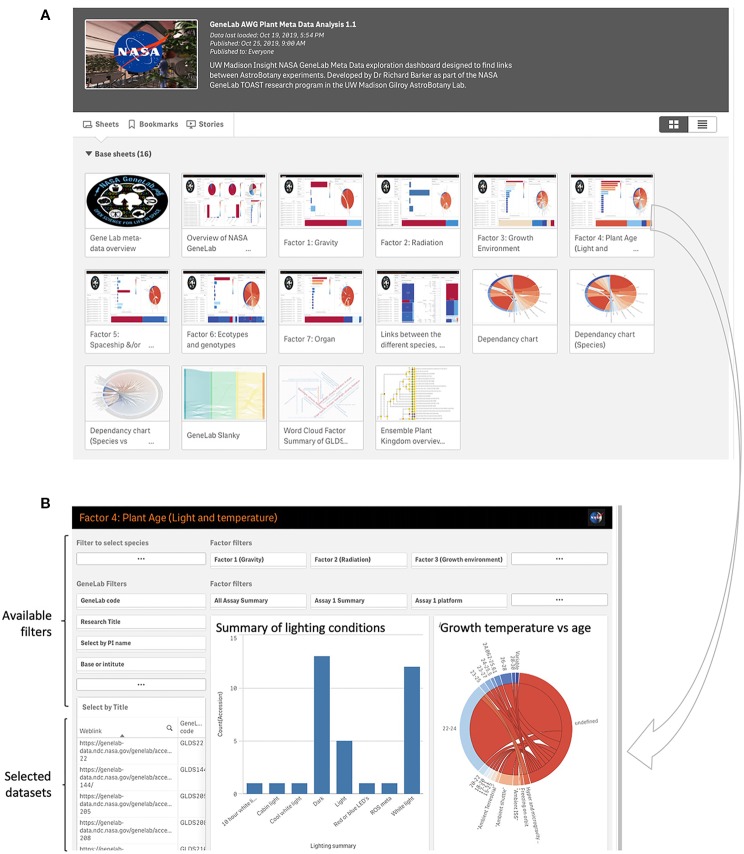
Figure 6.
Analysis of metadata within the TOAST 4.5. (A) Initial dashboards allow access to comparisons between a range of experiment-related factors such as lighting conditions, growth environment, and plant genotypes. (B) A typical dashboard for metadata exploration, in this case for light conditions and age of seedling. Preset filters for e.g., lab group performing the research and growth and radiation environments are available to the user and the identity of the filtered datasets is shown in the bottom left window.

