Figure 8.
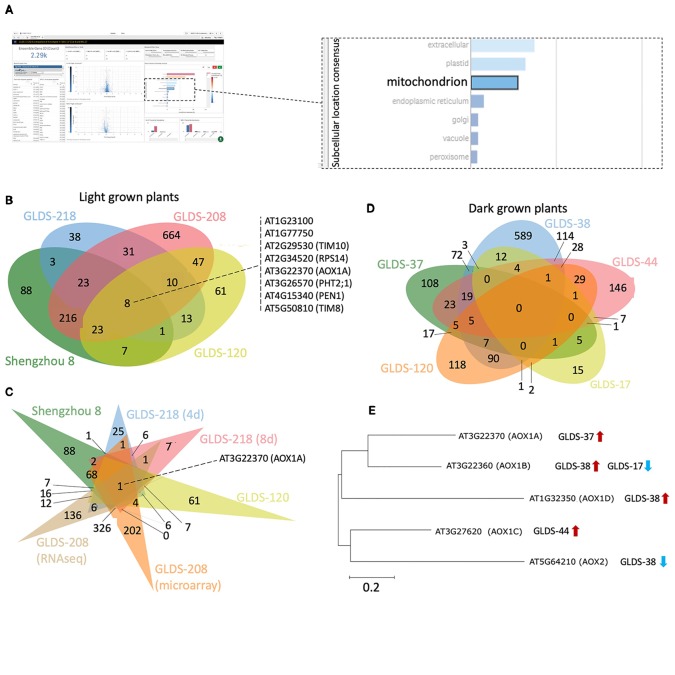
Analysis of mitochondrion-related genes altered by spaceflight. (A) Screenshot depicting an example of a user's interaction with the TOAST graphical user interface to define mitochondrion-related transcripts. (B) Using TOAST for iterative filtering of differentially expressed genes across multiple spaceflight studies where plants were light grown. (C) More extensive analysis of the studies in (B) using differentiation within the individual datasets for different analytical approaches (microarray vs RNAseq) and for different analysis periods (4 days vs 8 days). (D) Similar analysis but for dark grown plant samples. (E) The effects of spaceflight on the alternative oxidase gene family in dark grown samples. Maximum likelihood tree of AOX gene family generated using ClustalW alignment with Mega-X software (www.megasoftware.net). Venn diagrams plotted using jvenn (Bardou et al., 2014).

