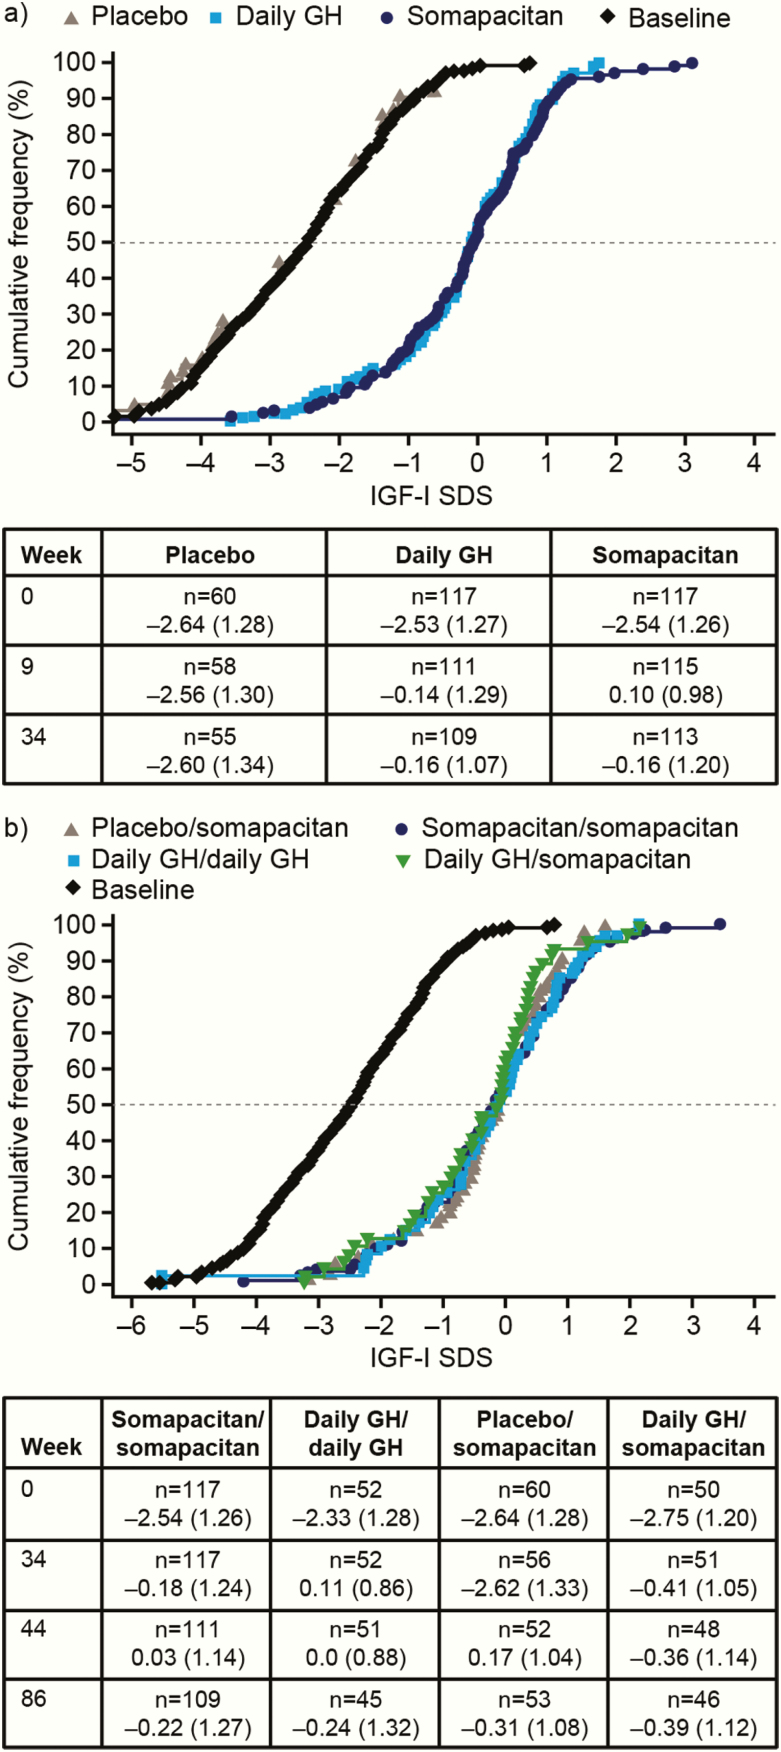
Figure 6.
Empirical distribution (cumulative frequency) of IGF-I SDS values. Mean values at specific timepoints are shown in the tables below the figures. (a) Main period: distribution at week 34. Baseline values are also shown. IGF-I SDS increased in the somapacitan and daily GH groups but not in the placebo group. (b) Extension period: distribution at week 86. IGF-I SDS increased in all treatment groups. The black curve shows baseline values. Weeks 9 (main period) and 44 (extension period) mark the first visit after the end of the titration period. Full analysis set. n values show the number of patients contributing data (IGF-I values were not available for all patients at all visits). Abbreviations: GH, growth hormone; IGF-I, insulin-like growth factor-I; SDS, standard deviation score.

