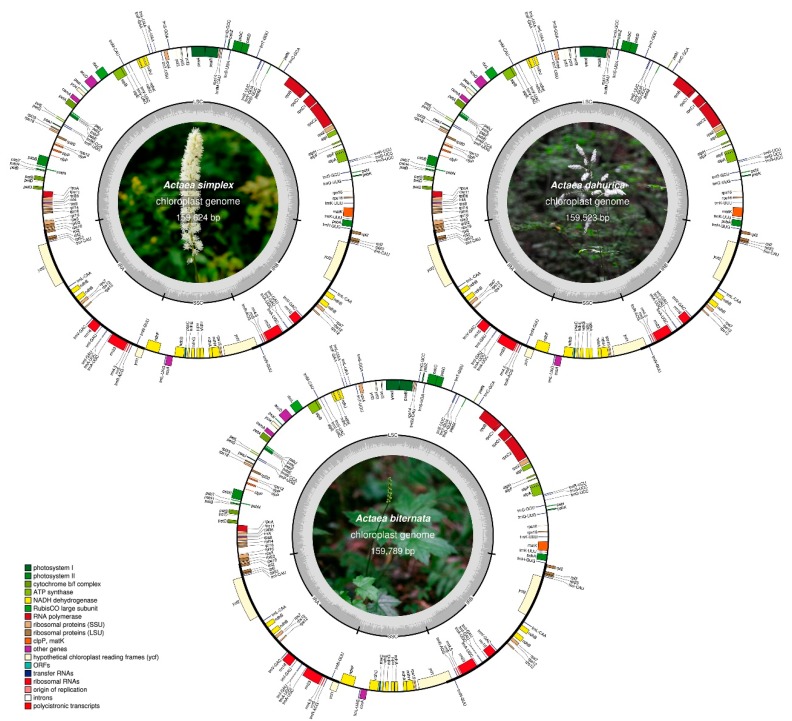
Figure 1.
Graphical maps of the cp genomes of A. simplex, A. dahurica, and A. biternata. Genes drawn inside the outermost circle are transcribed clockwise, and those outside the circle are transcribed counterclockwise. Dark gray shading in the inner circle indicates the GC content. The inner photograph shows Actaea.

