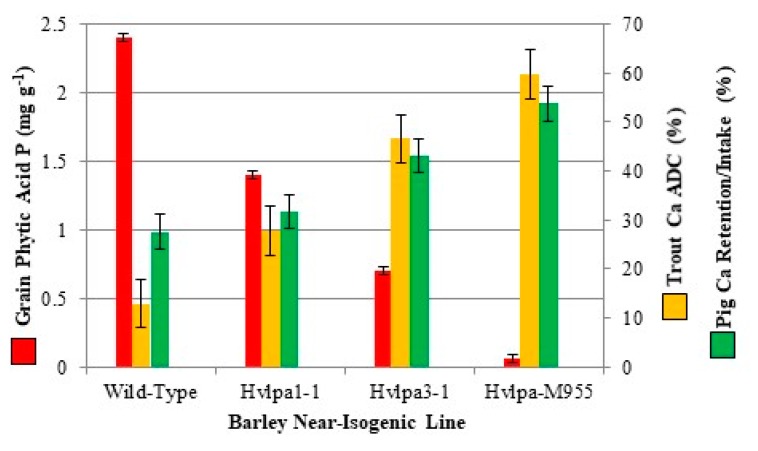
Figure 4.
The highly linear negative relationship between dietary calcium bioavailability and grain phytic acid level, as observed in two separate studies, one with pigs [44] and one with trout [45]. Calcium bioavailability was measured in trout as “apparent digestibility coefficient” (ADC) and in pigs as “% retention/intake”. Animals were fed diets prepared with four barley near-isogenic lines produced in the same location: (1) wild-type (for grain phytic acid, the cv. Harrington); Hvlpa1-1 with a ~40% reduction in grain phytic acid; Hvlpa3-1 with a ~70% reduction in grain phytic acid; and Hvlpa-M955 with a >95% reduction in grain phytic acid. Error bars are the standard deviation of the mean or “standard error” (SE) for each variable: grain phytic acid P, SE = 0.03, n = 3; Trout Ca ADC %, SE = 5.01, n = 2; Pig Ca retention/intake %, SE = 3.50, n = 5.

