Figure 3.
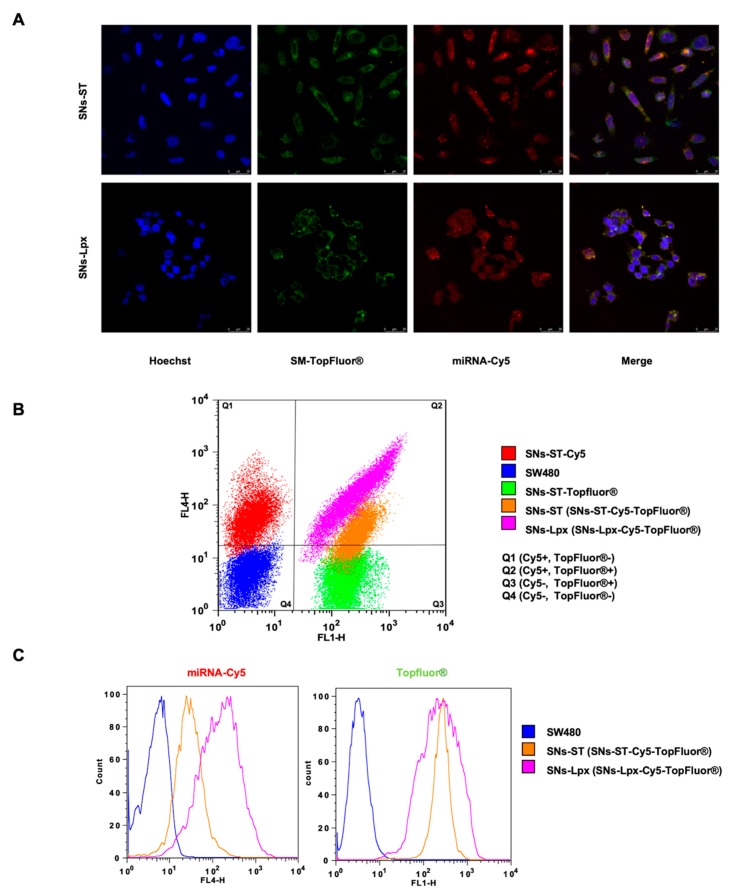
(A) Internalization of SNs-ST and SNs-Lpx in SW480. Maximal projection of confocal images upon incubation of nanosystems labeled with Sphingomyelin TopFluor® (green), and miRNA-Cy5 (red) (4 h at 37 °C). Cell nuclei were counterstained with Hoechst (blue). Scale bars represent 25 μm. (B) FACS results showing controls of untreated control cells (Q4, blue), cells positive for Cy5 (treated with SNs-ST-Cy5, Q1, red), cells positive for TopFluor® (treated with SNs-ST-TopFluor®, Q3, green), and double positive cells for Cy5 and TopFluor® (treated with either SNs-ST-Cy5-TopFluor®, Q2, orange, or SNs-Lpx-Cy5-TopFluor®, Q2, pink). (C) FACS Histogram of two different fluorophores, TopFluor® and Cy5, obtained for cells treated with double labeled nanoparticles, (SNs-ST-Cy5-TopFluor®, orange, or SNs-Lpx-Cy5-TopFluor®, pink).

