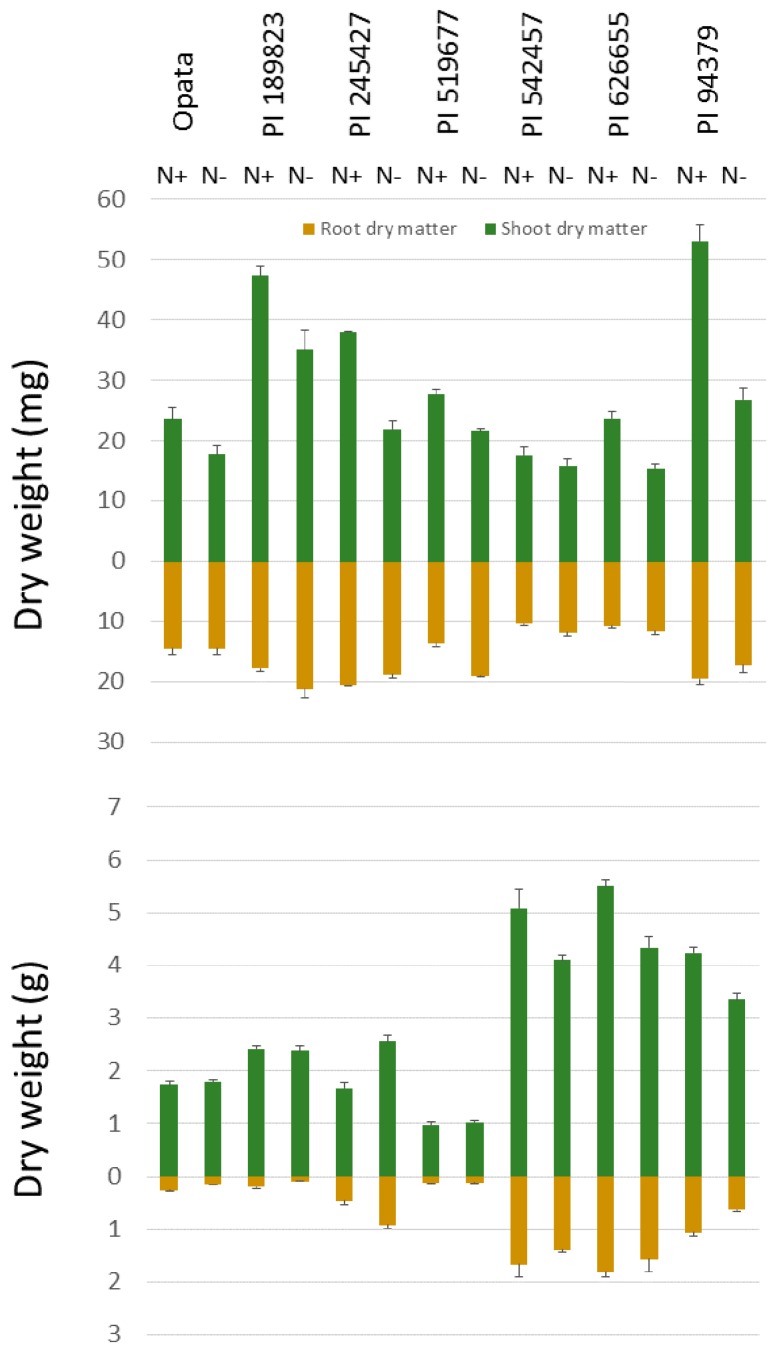
Figure 3.
Shoot and root dry matter presented for the seedling (top) and maturity (bottom) assays. Error bars represent the standard errors of the means for each line in each treatment. The root dry weight is presented below the horizontal axis to demonstrate that the mass recorded is from belowground.

