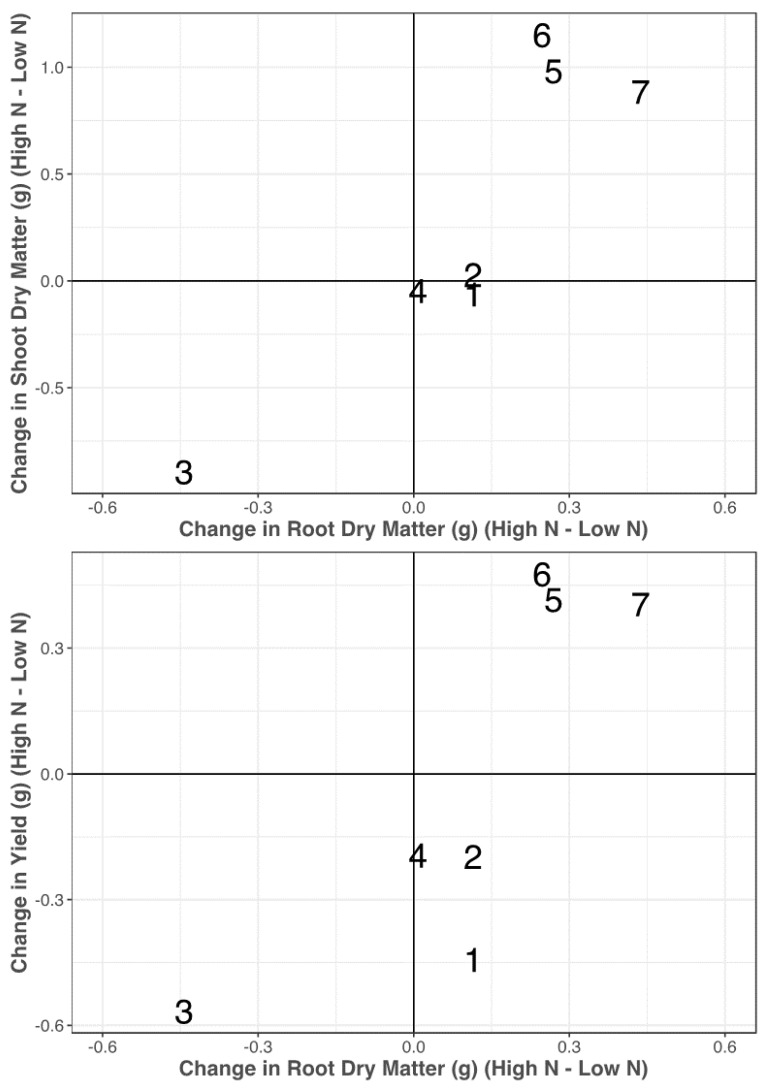
Figure 5.
Variation of biomass allocation responses with regard to N treatments (high N–low N). On the x axis is the change in root dry matter with change in shoot dry matter (top) and change in single-plant yield (bottom) on the y axis. Lines are distinguished as follows: Opata (1), PI 189823 (2), PI 245427 (3), PI 519677 (4), PI 542457 (5), PI 626655 (6), and PI 94379 (7).

