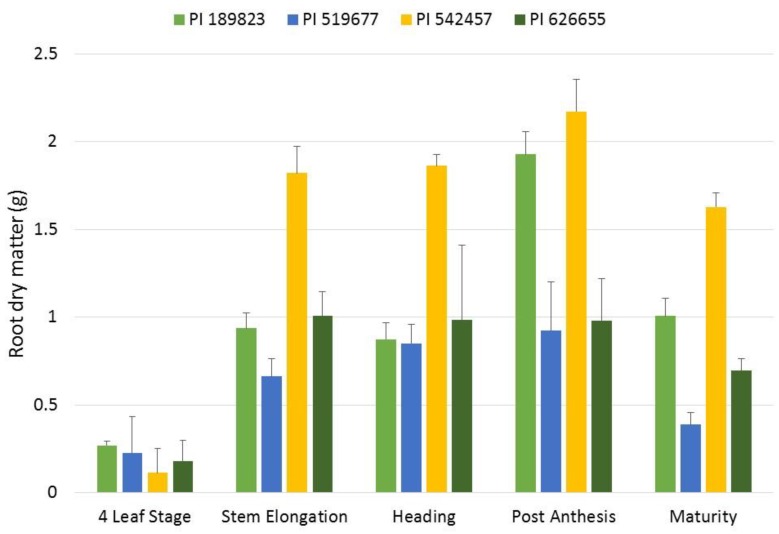
Figure 6.
Increases in root dry matter in the four lines across the sampling points. Mean root dry matter for each of the four lines at the five growth stages sampled in the temporal assay are presented. Error bars represent the standard errors of the means. The different colors represent the different lines in the study shown in the legend above the figure.

