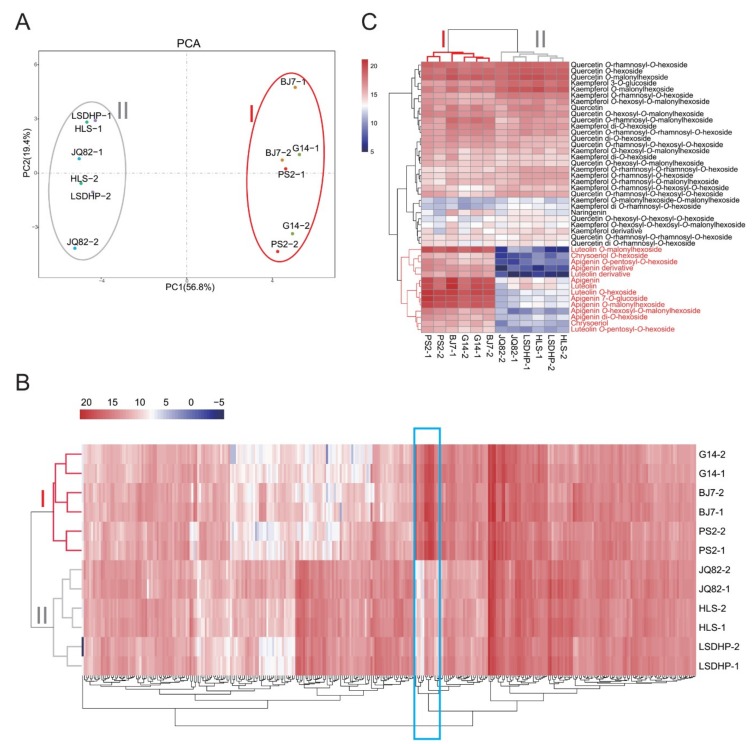
Figure 1.
Metabolome analyses of the leaves of six mulberry cultivars. (A) PCA score plot of metabolite profiles in leaves of mulberry cultivars BJ7, G14, PS2, HLS, JQ82, and LSDHP. (B) Hierarchical clustering of differentially accumulated metabolites in leaves of BJ7, G14, PS2, HLS, JQ82, and LSDHP. Blue box represents flavones. Intensity values were adjusted by log2 transformation, and are represented as colors ranging from white to red. (C) Hierarchical clustering of flavonoid metabolites in leaves of BJ7, G14, PS2, HLS, JQ82, and LSDHP. Intensity values were adjusted by log2 transformation, and are represented as colors ranging from navy to red.

