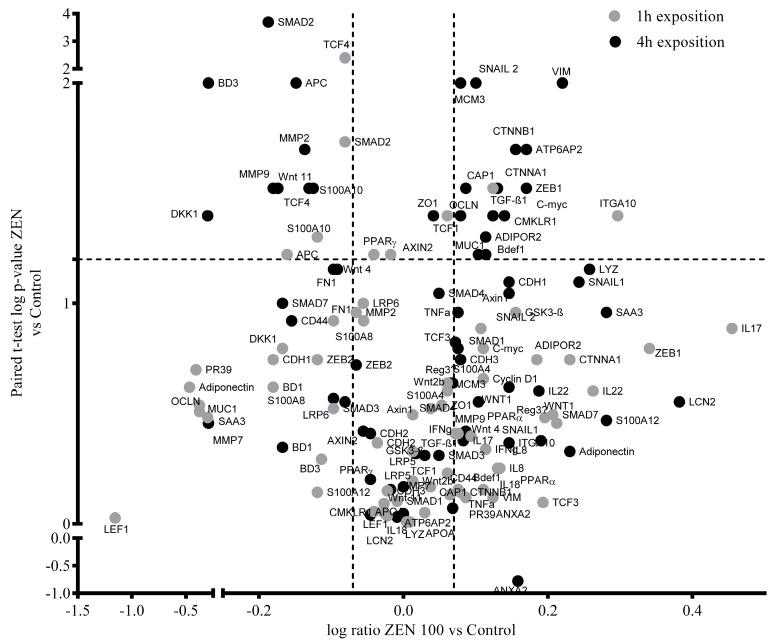
Figure 1.
Volcano plot of log significance (paired t-tests) versus log ratio on the y and x axes of ZEN-induced changes (100 μM) in gene expression. Black and grey dots represent gene expression changes after 4 h at 1 h of exposure, respectively. Horizontal and vertical dotted lines indicate the established levels of significance (p < 0.05; ratio = 1.2).

