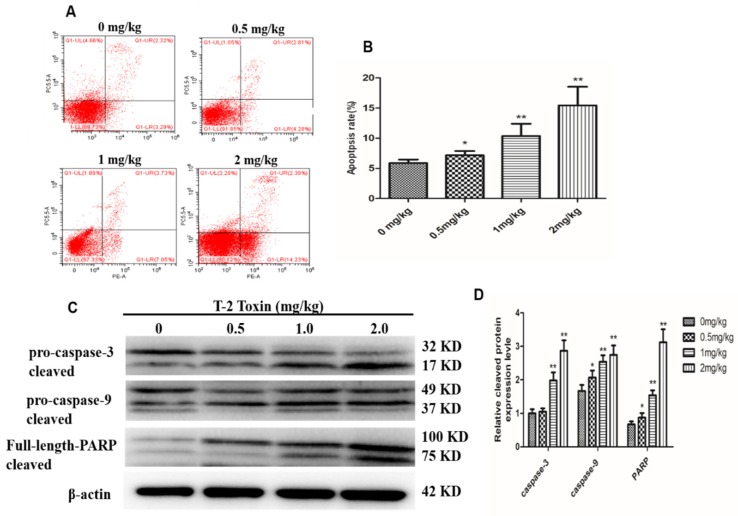
Figure 2.
Effect of different concentration (0, 0.5, 1 and 2 mg/kg, respectively) of T-2 toxin on hepatocyte apoptosis. (A) Scattergram and (B) apoptosis rate of apoptotic hepatocytes. (C) The protein levels of PARP, caspase-3 and caspase-9, and their cleaved forms in hepatocytes. (D) The bar showed the relative protein cleaved level of caspase-3, caspase-9 and PARP. The data are presented as the means ± standard error of the mean (SEM) of three independent experiments. * p < 0.05 and ** p < 0.01, compared with the control group.

