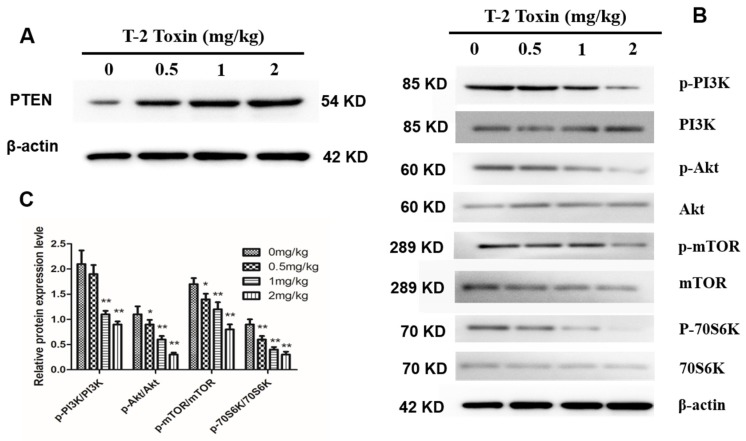
Figure 6.
Effect of T-2 toxin on PI3K/Akt/mTOR in hepatocytes. (A) Protein abundance of phosphatase and tensin homolog (PTEN) in hepatocytes from chickens treated with T-2 toxin of different concentration at 0, 0.5, 1 and 2 mg/kg. (B) Representative blots showed the expression abundance of p-PI3K, PI3K, p-Akt, Akt, p-mTOR, mTOR, p-70S6K and 70S6K in hepatocytes from chickens treated with T-2 toxin of different concentration at 0, 0.5, 1 and 2 mg/kg. (C) The bar graphs showed the ratio of p-PI3K/PI3K, p-Akt/Akt, p-mTOR/mTOR, and p-p70S6K/p70S6K. All the data are presented as means ± SEM of three independent experiments. * p < 0.05 and ** p < 0.01, compared with the control group.

