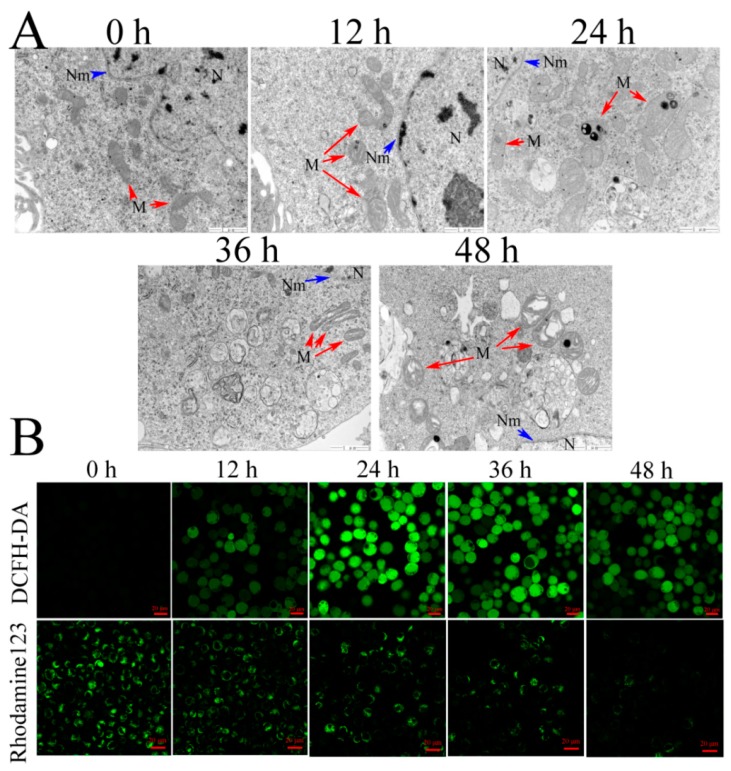
Figure 3.
Effects of Vip3Aa on mitochondria in Sf9 cells. (A) Representative photographs of mitochondria ultrastructure in Sf9 cells after exposure to Vip3Aa, obtained by TEM. N, nucleus. Nm, nuclear membrane (blue arrows). M, mitochondria (red arrows). Magnification, 30000 ×. Scale bar, 1 μm. (B) Effects of Vip3Aa on ROS production and mitochondrial membrane potential (ΔΨm) in Sf9 cells, which were determined by the fluorescent probe DCFH-DA and Rhodamine123, respectively. Scale bar, 20 μm.

