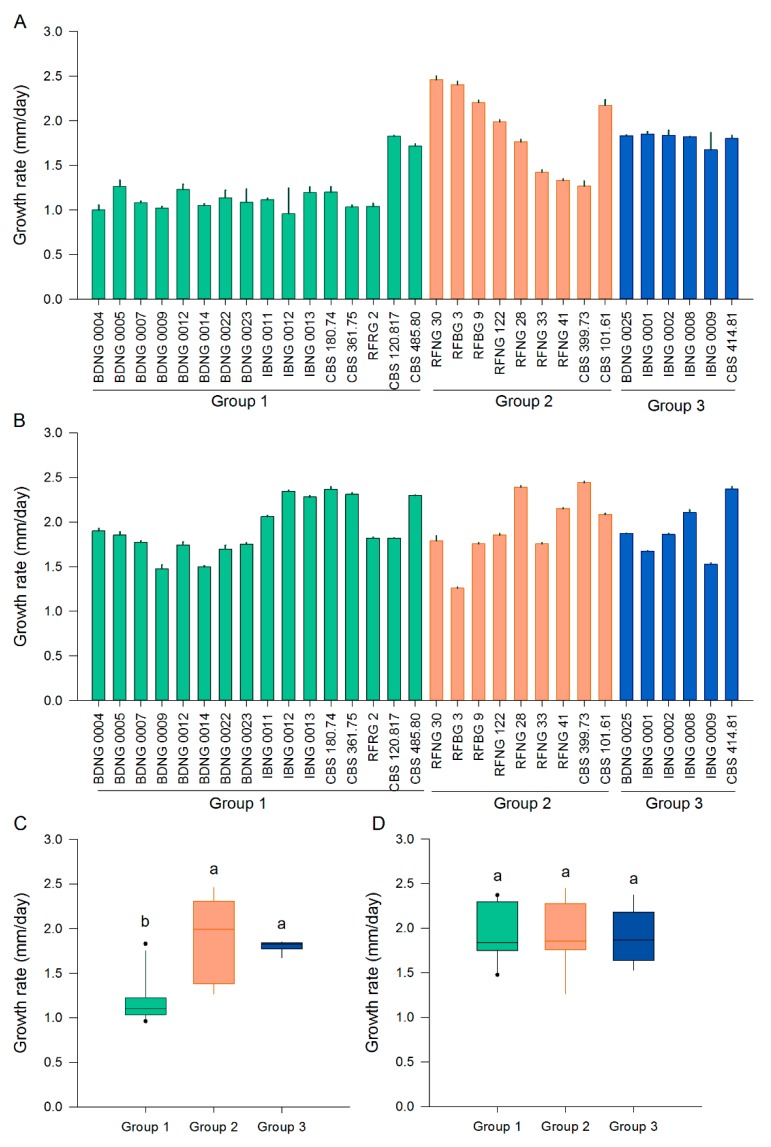
Figure 1.
Radial growth rate of S. oryzae isolates grown on potato dextrose agar (PDA) or oatmeal agar (OA). (A) Radial growth rate of individual isolates on PDA. (B) Radial growth rate of individual isolates on OA. All bars show the mean ± SE with three replicates for each isolate. (C) Radial growth rate of all isolates belonging to Groups 1, 2 and 3 on PDA. (D) Radial growth rate of all isolates belonging to Groups 1, 2 and 3 on OA. Isolates of Groups 1, 2 and 3 are represented by, respectively, green, orange and blue boxplots. Boxplots represent the median with the first and third quartile, the whiskers show the minimum and maximum values. Outliers and extreme values are represented by dots. Boxplots marked with different letters are statistically different (PDA: Mann–Whitney, 18 ≤ n ≤ 48, α = 0.05; OA: ANOVA, 18 ≤ n ≤ 48, α = 0.05).

