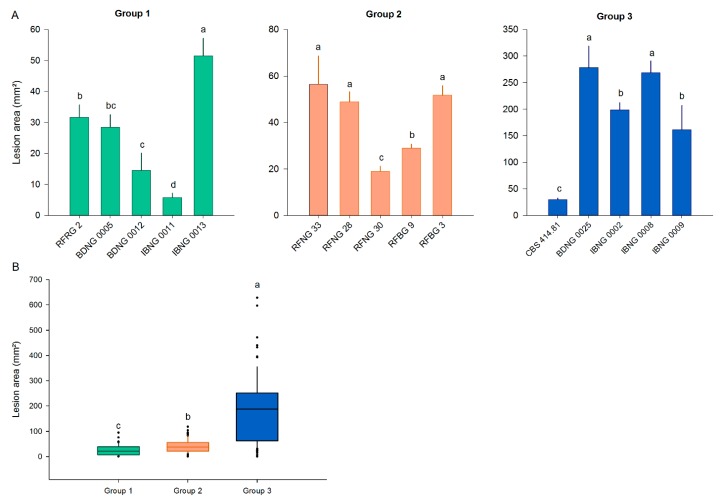
Figure 3.
Pathogenicity data of S. oryzae isolates of three lineages on Kitaake rice plants. When 7 weeks old, rice plants were inoculated with S. oryzae isolates belonging to Groups 1, 2 and 3 using the standard grain inoculum technique. At 8 DPI, the lesion area (mm2) was measured. (A) Bars show the mean ± SE of each isolate tested, with eighteen replicates for each isolate. Bars marked with different letters are statistically different (Mann–Whitney, n = 18, α = 0.05). (B) Each boxplot shows the lesion area caused by all five isolates belonging to one lineage. Groups 1, 2 and 3 are represented by, respectively, green, orange and blue boxplots. All boxplots represent the median with the first and third quartile, the whiskers show the minimum and maximum values. Outliers and extreme values are represented by dots. Boxplots marked with different letters are statistically different (Mann–Whitney, n = 90, α = 0.05).

