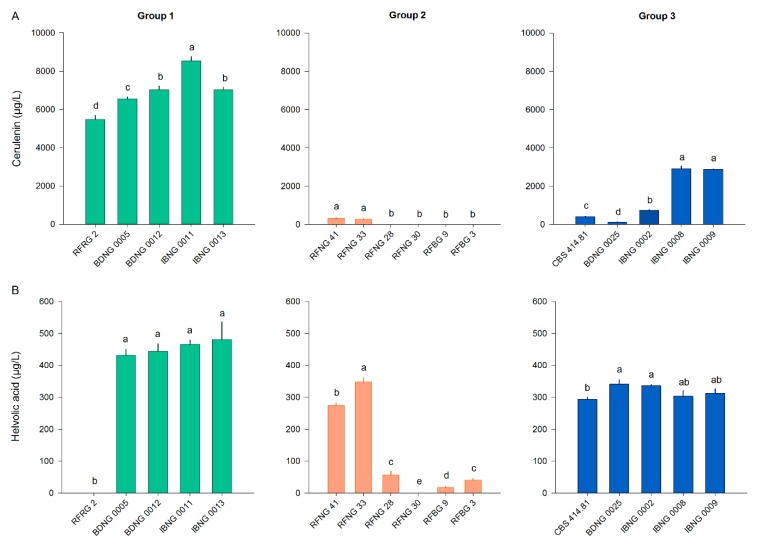
Figure 4.
Cerulenin and helvolic acid production by S. oryzae isolates on PDA. S. oryzae isolates of Groups 1, 2 and 3 were grown for 7 days on PDA. The concentration of (A) cerulenin (µg/L) and (B) helvolic acid (µg/L) in the extract of the culture was measured with liquid chromatography high-resolution mass spectrometry. Isolates of Groups 1, 2 and 3 are represented by, respectively, green, orange and blue bars. All bars show the mean ± SE of the toxin levels with five replicates for each isolate. Bars marked with different letters are statistically different (Mann–Whitney, n = 5, α = 0.05).

