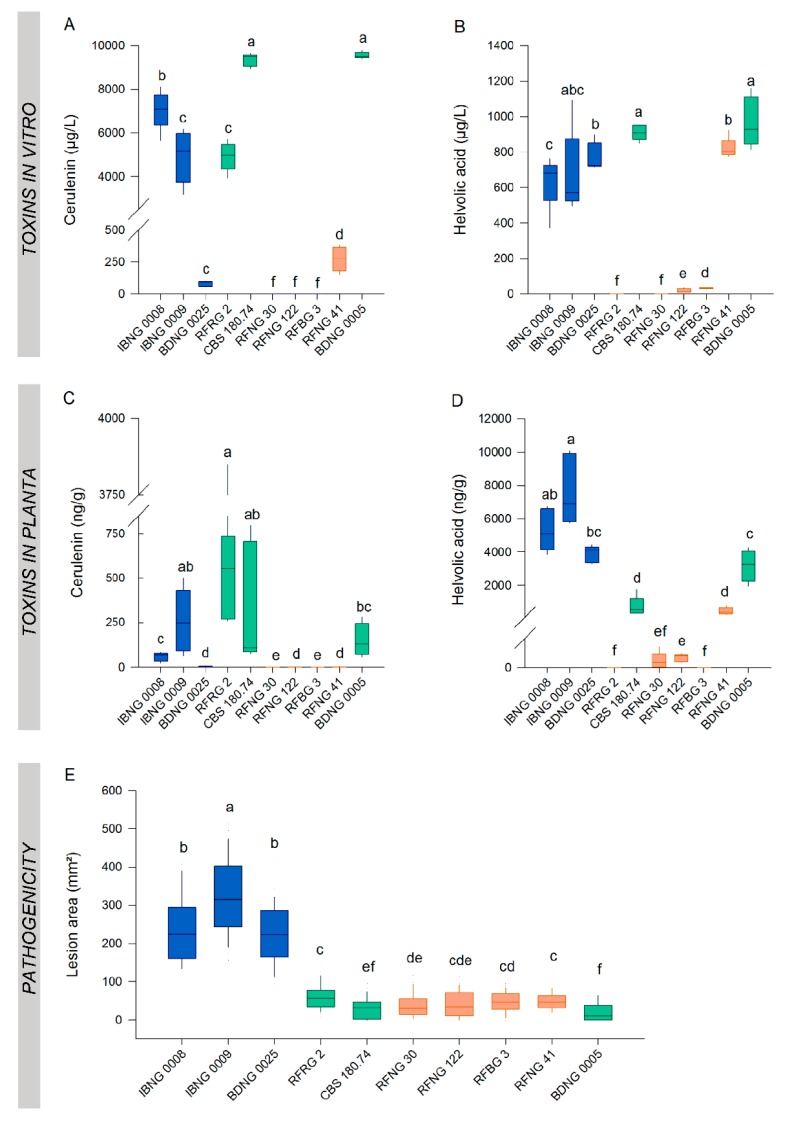
Figure 6.
Toxin production in vitro and in planta versus pathogenicity on rice. S. oryzae isolates were grown for 7 days on PDA. The concentration of (A) cerulenin (µg/L) and (B) helvolic acid (µg/L) in the extract of the culture was measured with liquid chromatography high-resolution mass spectrometry. When 7 weeks old, rice plants were inoculated with the same strains of S. oryzae using the standard grain inoculum technique. At 6 DPI, (C) cerulenin (ng/g) and (D) helvolic acid (ng/g) levels were analysed in sheath samples and (E) the disease was scored by measuring the lesion area (mm2). Isolates of Groups 1, 2 and 3 are represented by, respectively, green, orange and blue boxplots. All boxplots represent the median with the first and third quartile, the whiskers show the minimum and maximum values. Outliers and extreme values are represented by dots. The boxplots show data of 1 experiment with five replicates for each isolate for toxin concentrations (A–D) and 25 replicates for each isolate for the lesion area (E). Boxplots marked with different letters are statistically different (Mann–Whitney, n = 5 or n = 25, α = 0.05).

