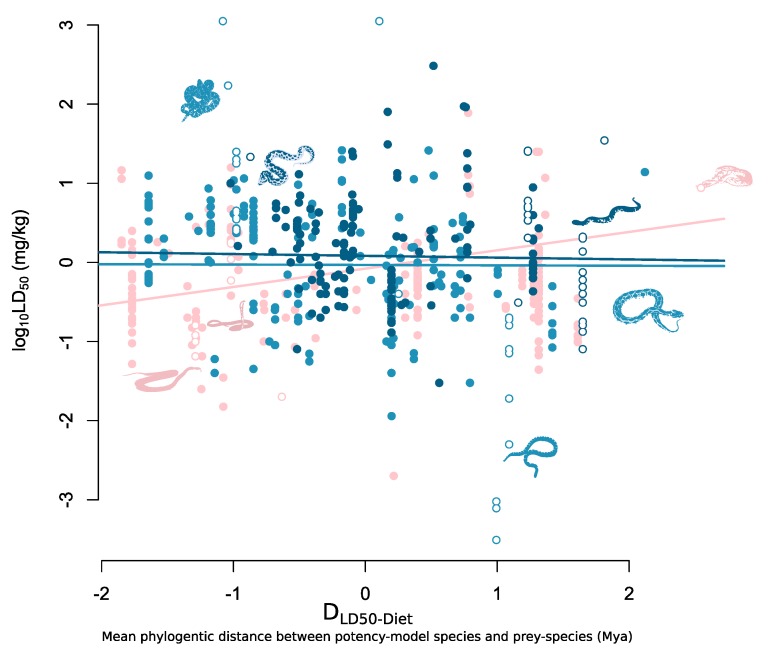
Figure 2.
Mean phylogenetic distance between potency-model species and natural prey (DLD50-Diet) against log10 LD50. Species with only a single taxonomic group represented in their diets are represented by the pink points and fitted line (intercept = 0.33, slope = 0.22); species with an intermediate diversity of taxonomic groups represented in their diets are represented by the blue points and fitted line (intercept = 0.39, slope = 0.00); and species with high taxonomical diverse diets are represented by the dark blue points and fitted line (intercept = 0.45, slope = −0.03). Hollow points represent silhouette species which are, from left to right: Oxyuranus scutellatus; Crotalus adamanteus; Ophiophagus hannah; Vipera latastei; Agkistrodon piscivorus; Bungarus multicinctus; Daboia russelii; Causus rhombeatus.

