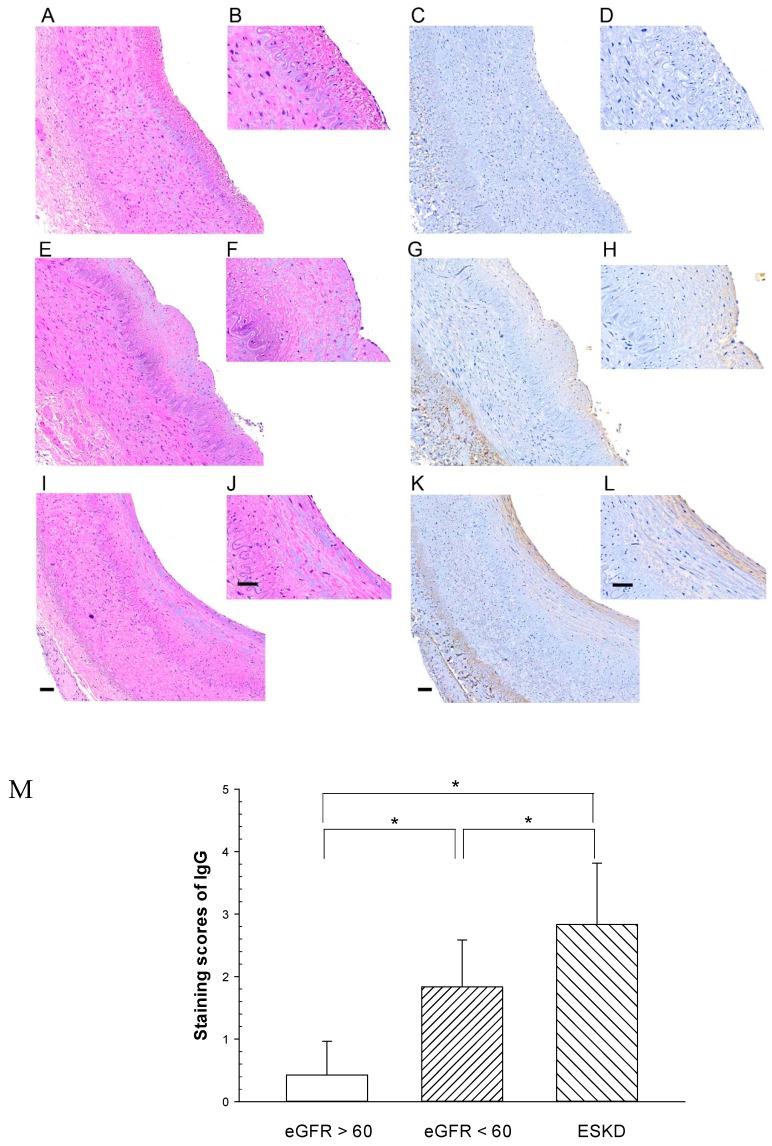
Figure 6.
Representative immunohistochemical staining of IgG in CKD patient’s renal artery. Immunostaining for IgG was performed on transverse sections of three groups: (Figs. C, D) eGFR >60, (Figs. G, H) eGFR < 60 but not starting dialysis therapy, (Figs. K, L) end stage kidney disease (ESKD) on regular dialysis. The presence of IgG was indicated by brown reaction products with anti-IgG antibodies. Figs A, B, E, F, I, J: Hematoxylin/eosin staining in the adjacent sections. Large figures were displayed with a 20 × objective of the virtual microscopy software. Small figures were 2 times higher magnifications. Calibration bar = 50 um. Figure M IHC staining sores for IgG were shown on the y–axis (mean + SD; n = 6–7/group). * significant difference (p < 0.05).

