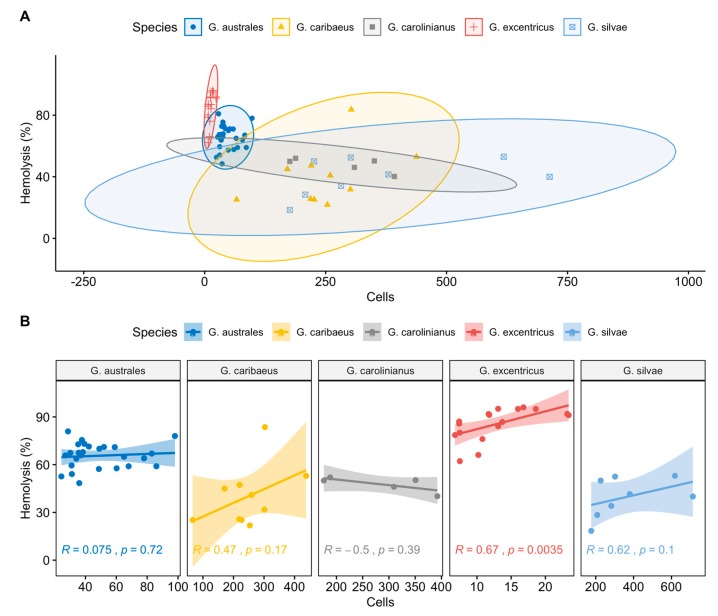
Figure 4.
Scatter plot (A) and line regression (B) of the relationship between cell abundance and haemolysis (%) for each Gambierdiscus strain. Ellipses and shaded areas in panels A and B represent the 95% confidence intervals. Correlation coefficients (R) and p-values are indicated in each line regression plot.

