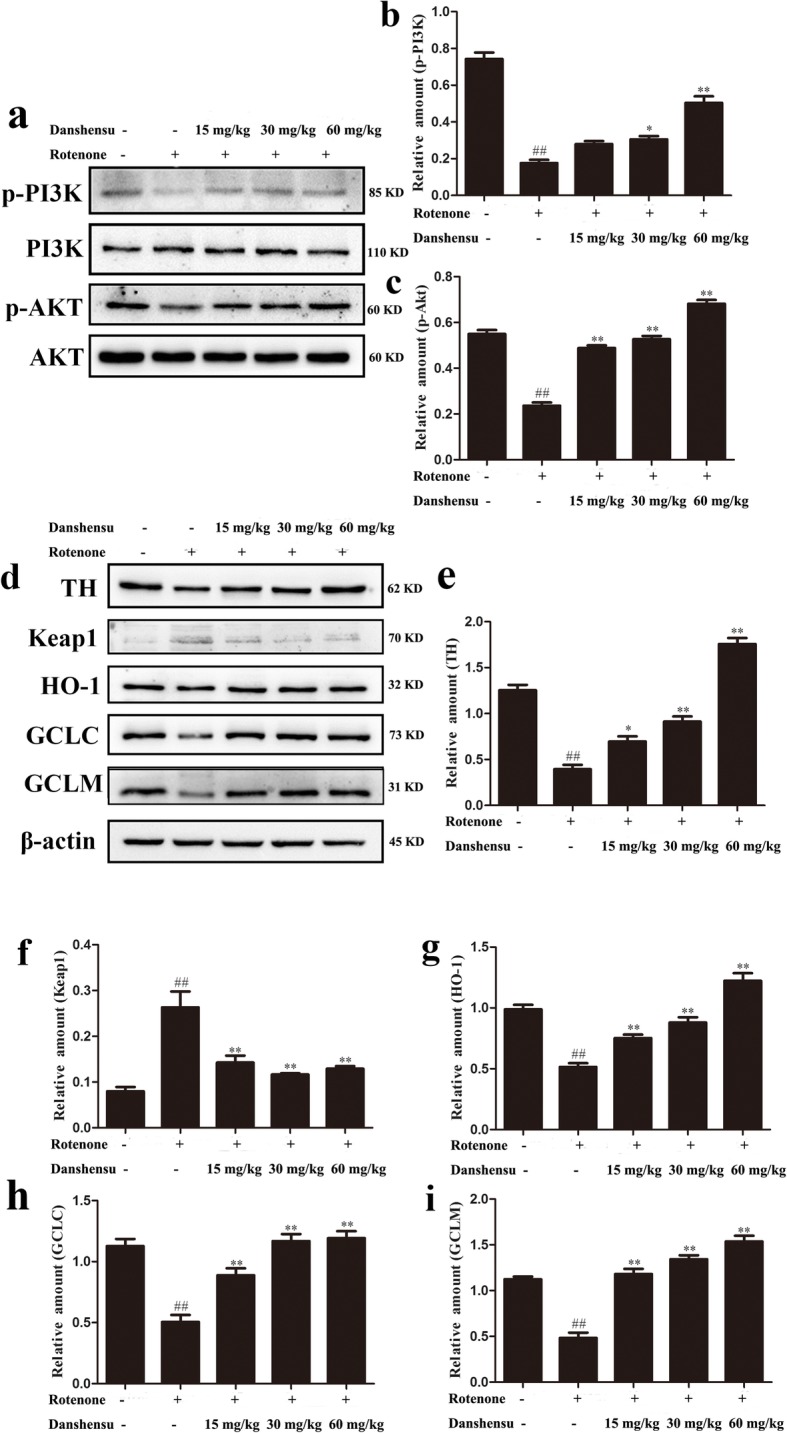
Fig. 6.

Effect of Danshensu on the expressions of nuclear translocation of Nrf2 in rotenone-induced PD mice. a showed representative photographs of Nrf2 in western blot measurement. b indicated bar graphs of Nrf2 expression in western blot measurement. The data were expressed as the Mean ± SEM. Statistical analyses were performed using One-way ANOVA followed by Tukey’s post hoc test. ##P < 0.01 compared with the control group; *P < 0.05, **P < 0.01 compared with the rotenone group. a Representative photographs of p-PI3K, PI3K, p-AKT, AKT in Western blot. b Bar graph of quantitative analysis of the expression of p-PI3K. c Bar graph of quantitative analysis of the expression of p-AKT. d Representative photographs of TH, Keap1, HO-1, GCLC, GCLM in Western blot. e Bar graph of quantitative analysis of the expression of TH. f Bar graph of quantitative analysis of the expression of Keap1. g Bar graph of quantitative analysis of the expression of HO-1. h Bar graph of quantitative analysis of the expression of GCLC. i Bar graph of quantitative analysis of the expression of GCLM
