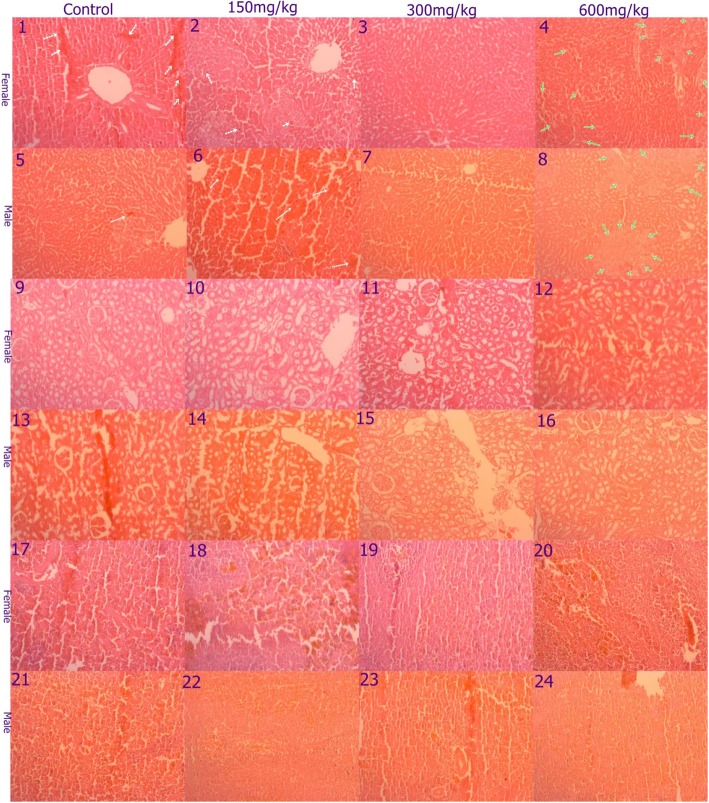
Fig. 3.
Photomicrograph of liver, kidney and spleen in sub-acute oral toxicity. Mild spotty liver necrosis was observed in either sex of of control and low dose (1, 2, 5, and 6) indicated by white arrow. Groups in medium dose group of either sex showed normal morphology (3 and 7). Liver of high dose treated groups in either sex showed moderate fatty change (green arrow), 4 and 8. Kidney of all groups in box sex showed normal morphology (9–16). Spleen of all groups showed normal but mild sinusoidal congestion (17–24)

