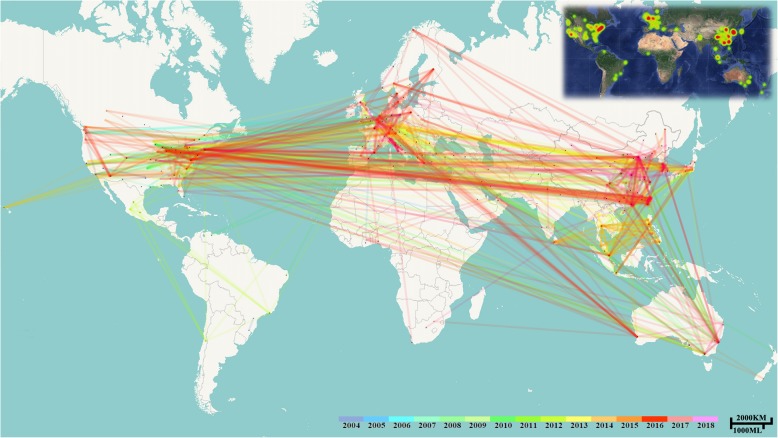
Fig. 1.
The world distribution and collaboration on the topic of TCAM for stroke. The distribution heat map was created using the Google Fusion Table and the collaboration map was created using CiteSpace VI software. Lines link the nodes on the map, representing the worldwide collaboration among institutes. The range and the color of the heat on the top-right corner indicate the number of articles at specific locations

