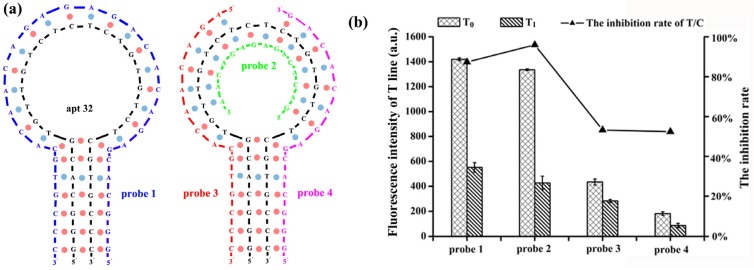
Figure 3.
Optimization of the complementary sequence on the T-line (T0 and T1 correspond to the fluorescence intensity of T-line in the absence and presence of 100 ng/mL AFB1). (a) The complementary relationship of probe 1, probe 2, probe 3, and probe 4 with apt 32. (b) The variation of the fluorescence intensity of T-line and inhibition rate with different complementary DNA probes.

