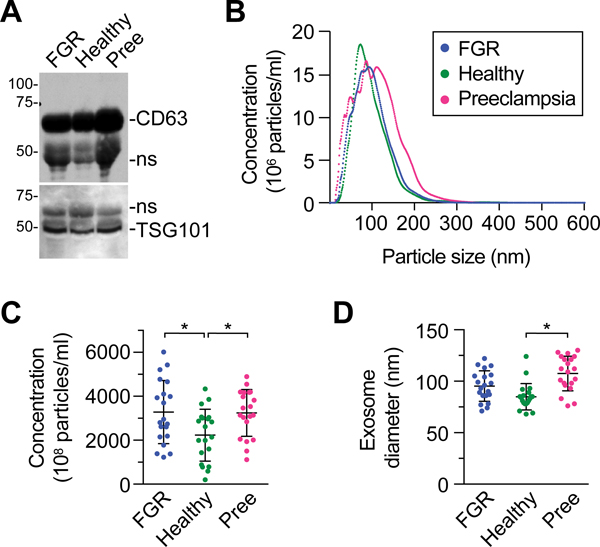
Fig. 1: Isolation and characterization of plasma exosomes.

(A) A representative western blot showing the expression of exosomal tetraspanins CD63 and TSG101. As exosomes do not express standard proteins used for loading control, samples are normalized by loading 20 ug of protein. Non-specific (ns) bands are marked. (B) The profile of plasma exosome concentration across a range of particle sizes, determined using NTA as described in Methods. (C) The concentration of exosomes in plasma samples from the three conditions (expressed as mean exosome number x 108/ml plasma: FGR: 3282, Healthy: 2232, Preeclampsia: 3242). (D) The distribution of exosome diameter in plasma samples from the three conditions. A and B are representative experiments (n=3). C and D include samples from all participants (n=20 in each condition, and * denotes p <0.05.
