
Fig. 5: A comparison of differentially expressed miRNA between plasma exosomes and total plasma.
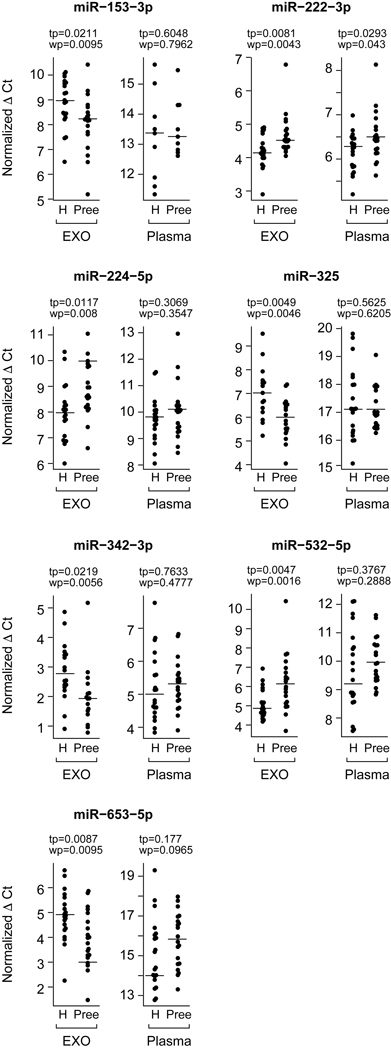
We focused on differentially expressed miRNA (Fig. 4) between preeclampsia and control samples. The y-axis is the expression of miRNAs in Ct value, normalized to the median (see Methods). The p values for both the t-test and Wilcoxon rank sum test are shown. Note that higher Ct value represents lower expression.