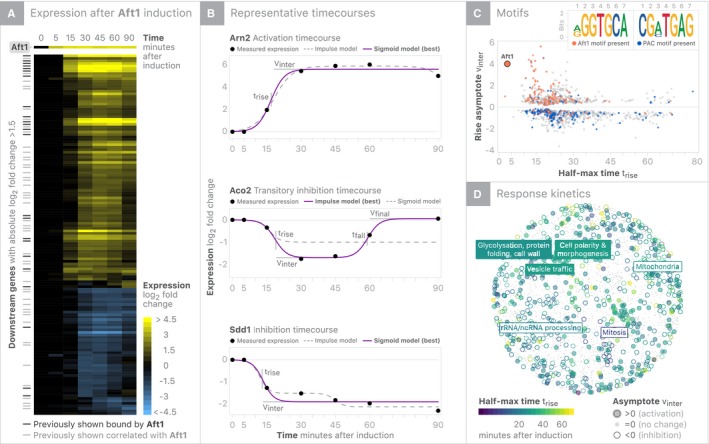
Figure 2. Characterizing the downstream responses of Aft1 induction.

- Heatmap summary of Aft1 induction experiment showing all genes that change with |log2(fold change)| > 1.5.
- Parametric summaries of representative sigmoidal activation and inhibition timecourses and impulse (double sigmoid) modeling of transitory inhibition. Sigmoids are summarized by half‐max time (t rise) and the asymptote (v inter), while impulses include a second half‐max (t fall) time and final asymptote (v final). The strongest supported model for each timecourse is shown as a filled in line, while the alternative model is shown with a dashed line.
- K‐mers enriched in the promoters of regulated genes are overlaid on summary of each gene's t rise and v inter. The presence of the Aft1 motif is associated with early activation, while early inhibition is associated with the PAC motif (Tod6/Dot6).
- Response kinetics are overlaid on gene coordinates based on genetic interaction as a surrogate for functional similarity. Up‐regulated genes are enriched for vesicle trafficking/glycosylation/polarity processes, and down‐regulated genes are enriched for mitochondrial/mitotic/rRNA processes.
