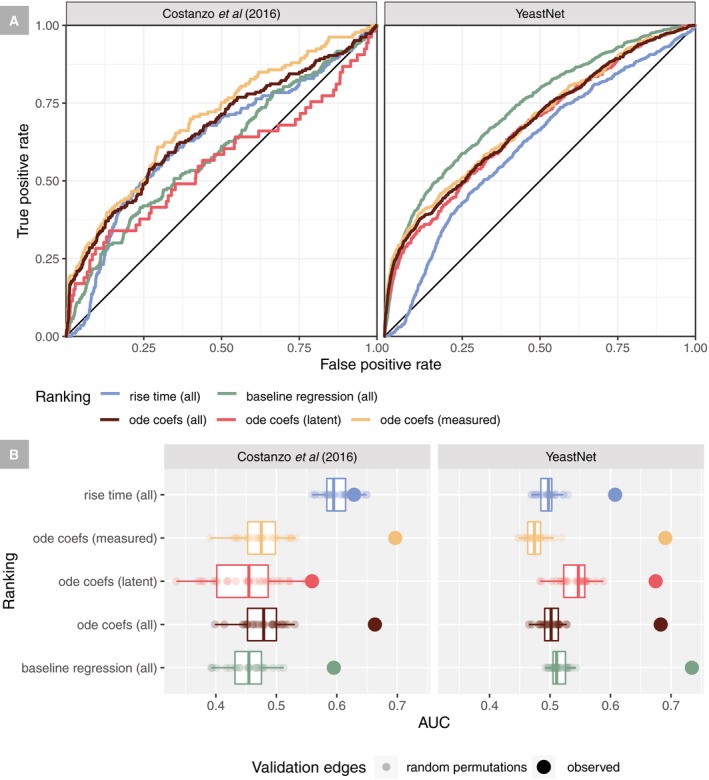
The rankings of observed induction responses (ascending by
t
rise) and predicted regulator relationships (descending by regression coefficient magnitude) were used to predict edges in two networks (Costanzo
et al,
2016 and YeastNet v.3). All non‐zero ODE regression coefficients were split into two classes: measured (predicted regulators with an induction experiment) and latent (predicted regulators without an induction experiment).
ROC curves are shown treating interactions, which overlap with the query edges (non‐zero regression coefficients), as positives and all other entries as negatives.
The AUC of the ROC curves in (A) are shown as large dots, compared to 25 random permutations (which preserve the counts of each cause and effect but randomize their pairings) of the edge list which are shown as small dots and a boxplot of these null AUCs. Permutations with values systematically in excess of a value of 0.5, as seen when predicting genetic interactions with rise time, are likely due to hub effects where genes that tend to be predicted regulators of many targets also tend to have interactions. For boxplots, the central line is the median, hinges correspond to the first and third quartiles, and whiskers extend to the minimum and maximum values.

