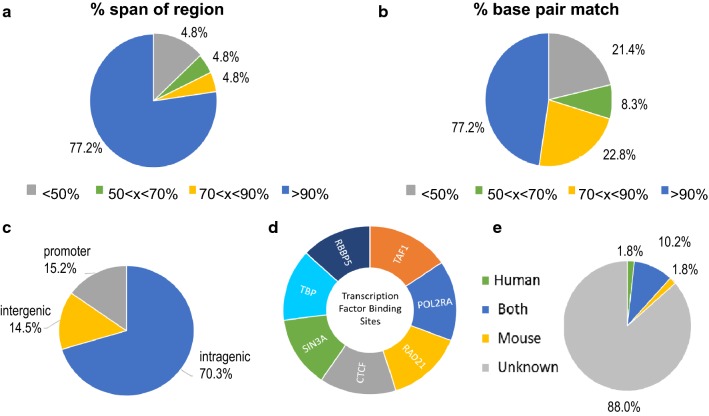
Fig. 1.
Characterization of conserved DNMT1-dependent regions in the Human genome. a The percent span of the DNMT1-dependent regions in mouse covered by the identified human conserved regions. Pie chart represents the percentage of all identified conserved regions in the human genome that fall into each category. b The percent base-pair match of the DNMT1-dependent regions in mouse with the identified human conserved regions. Pie chart represents the percentage of all conserved regions in the human genome that fall into each category. c The percentage of all conserved regions in the human genome that are located within the promoter, the gene body, or in non-coding intergenic regions. d The top transcription factor binding sites found within all human conserved regions. e The percentage of known germline ASMs in our conserved DNMT1-dependent regions separated by genome

