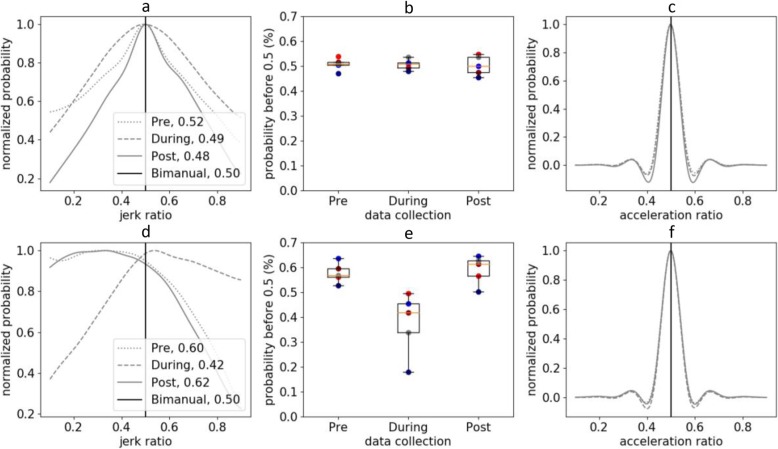
Fig. 1.
a: Jerk ratio histogram across all three collection periods of one TD participant. b: JR50 of all TD children demonstrates high similarity between participants and across collection periods. c: Sample distribution if acceleration was used versus jerk. d, e, f present the same information for the CP group. Note the asymmetric JR distribution for one child with CP (d), changes in JR50 with therapy, and that these differences are not detected if acceleration was used (f). Similar distribution plots (e.g., a and d) for all participants can be found in the Supplementary Material or generated from the open-source code. The colored circles (b and e) show JR50 for each child

