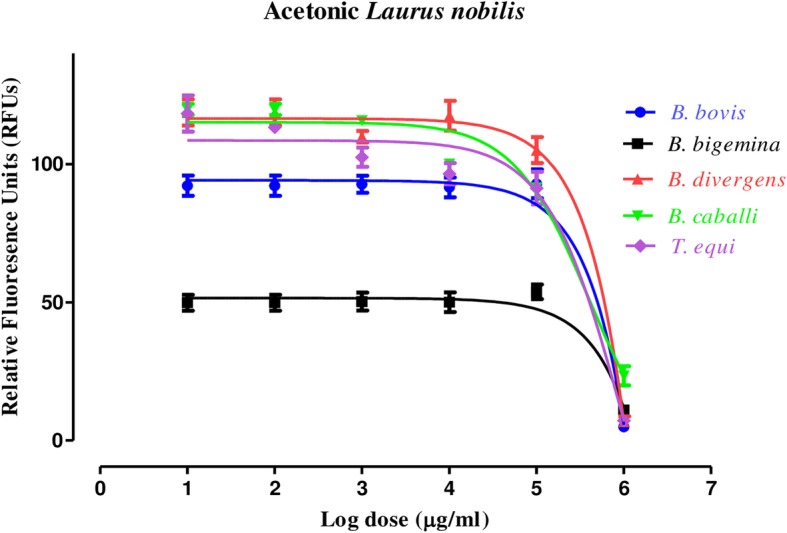
Fig. 2.

The relationship between the relative fluorescence units (RFUs) and the log concentrations of acetonic L. nobilis (AELN) (μg/mL) on T. equi, B. divergens, B. bigemina, B. caballi, and B. bovis. The non-linear regression (curve fit analysis) in GraphPad Prism software (GraphPad Software Inc. USA) used for IC50’s calculation. The percentage of parasite growth inhibitory efficacy is calculated as the percentage of parasites inhibited divided by that of the positive control wells and the result was subtracted from the negative control wells
