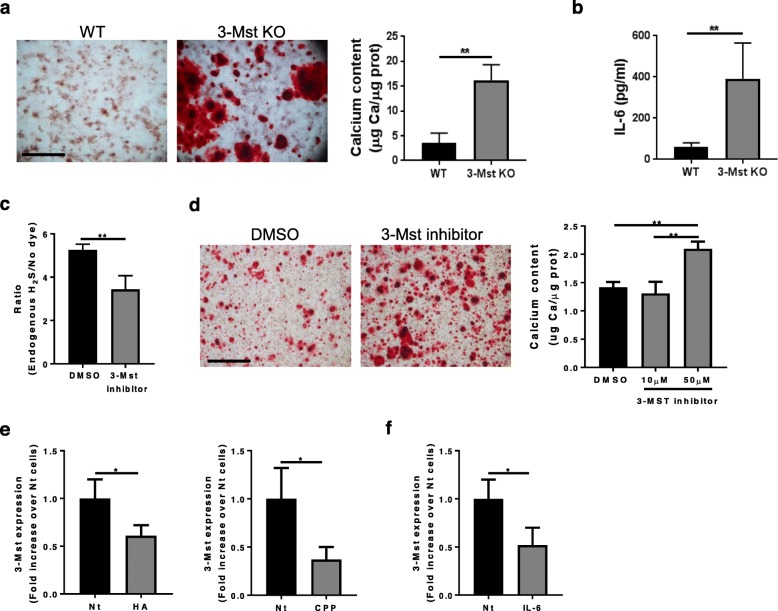
Fig. 3.
Endogenously H2S produced by 3-MST regulates chondrocytes calcification and IL-6 secretion and vice versa. a Alizarin red staining of WT and 3-MST KO chondrocytes cultured with CPP for 24 h. Pictures represent triplicates from one experiment of three independent experiments. Graph represents calcium content in the cell monolayer, expressed in μg Ca/μg protein. n = 3. b IL-6 secretion in cell supernatant of WT and 3-MST KO chondrocytes from point (a). n = 3. c FACS analysis of endogenous H2S production by WT chondrocytes treated for 6 h with vehicle (DMSO) or 50 μM 3-MST inhibitor and incubated with P3 probe. n = 3. d Alizarin red staining of WT chondrocytes cultured in CPP for 24 h in the presence or absence of 50 μM 3-MST inhibitor. Pictures represent triplicates from one experiment of three independent experiments. Graph represents calcium content in the cell monolayer, expressed in μg Ca/μg protein. n = 3. e qRT-PCR for 3-Mst gene expression in WT chondrocytes stimulated or not with 500 μg/ml HA crystals or CPP for 4 h, or with (f) 10 ng/ml IL-6. n = 3

