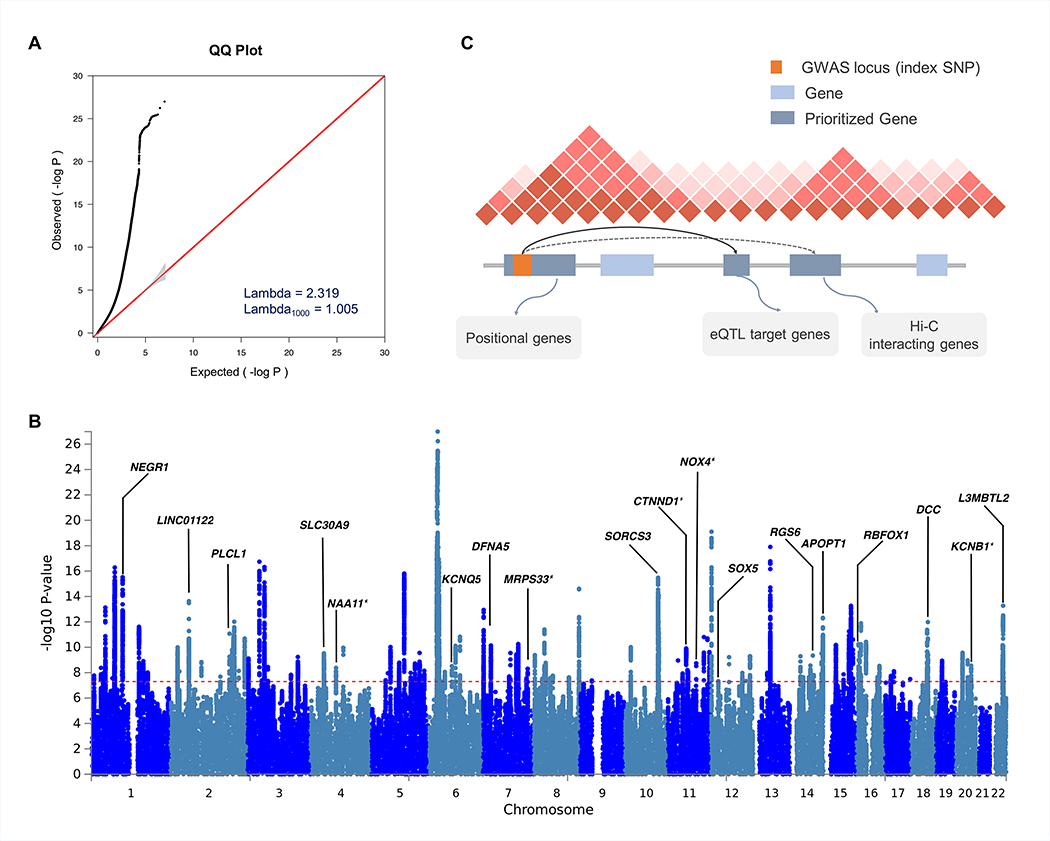
Figure 2. Results of cross-disorder meta-analysis and candidate gene mapping.
(A) Quantile-quantile (QQ) plot displaying the observed meta-analysis statistics vs. the expected statistics under the null model of no associations in the -log10(p-value) scale. Although a marked departure is notable between the two statistics, the estimated lambda1000 and the estimated LD Score regression intercept indicate that the observed inflation is mainly due to polygenic signals rather than major confounding factors including population stratification. (B) Gene prioritization strategies for significantly associated loci. Candidate genes were mapped on each locus if the index SNP and credible SNPs reside within a protein-coding gene, are eQTL markers of the gene in the brain tissue, or interact with promoter regions of the gene based on brain Hi-C data. (C) Manhattan plot displaying the cross-disorder meta-analysis results highlighting candidate genes mapped to top pleiotropic regions. When multiple genes were mapped to the same locus, genes encompassing the index SNP or genes with the largest number of evidences were displayed for clarity. Candidate genes that have not previously implicated in individual disorder GWAS are marked with an asterisk.

