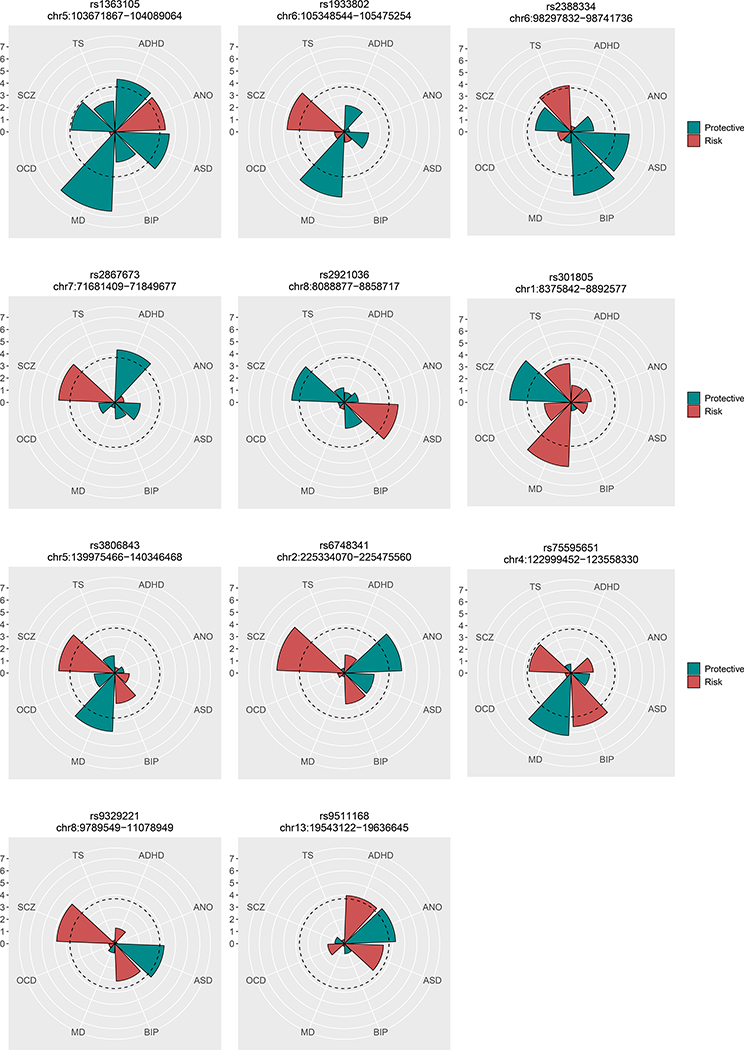
Figure 4. Eleven loci with opposite directional effects.
The radius of each wedge corresponds to the absolute values of the Z-scores (log(Odds ratios)/S.E) obtained from association tests of the SNP for eight disorders. The color indicates whether the examined SNP carries risk (red) or protective effects (green) for each disorder. The dotted line around the center indicates statistically significant SNP effects that account for multiple testing of 206 SNPs the q-value of 0.001.

