Fig. 1.

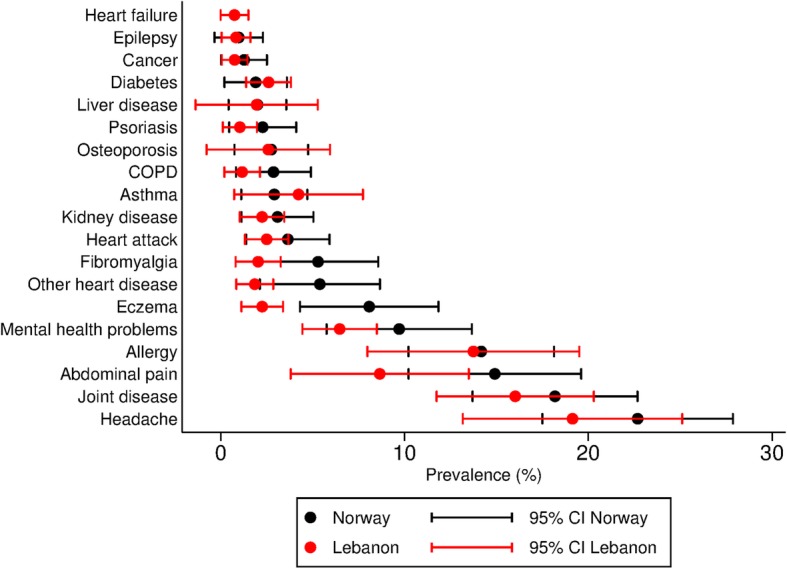
Lifetime prevalence proportions of selected conditions and symptoms with confidence intervals. Prevalence proportions standardised to the age and gender distribution of the total Syrian population in Norway by the end of 2017 [6]

Lifetime prevalence proportions of selected conditions and symptoms with confidence intervals. Prevalence proportions standardised to the age and gender distribution of the total Syrian population in Norway by the end of 2017 [6]