Figure 3.
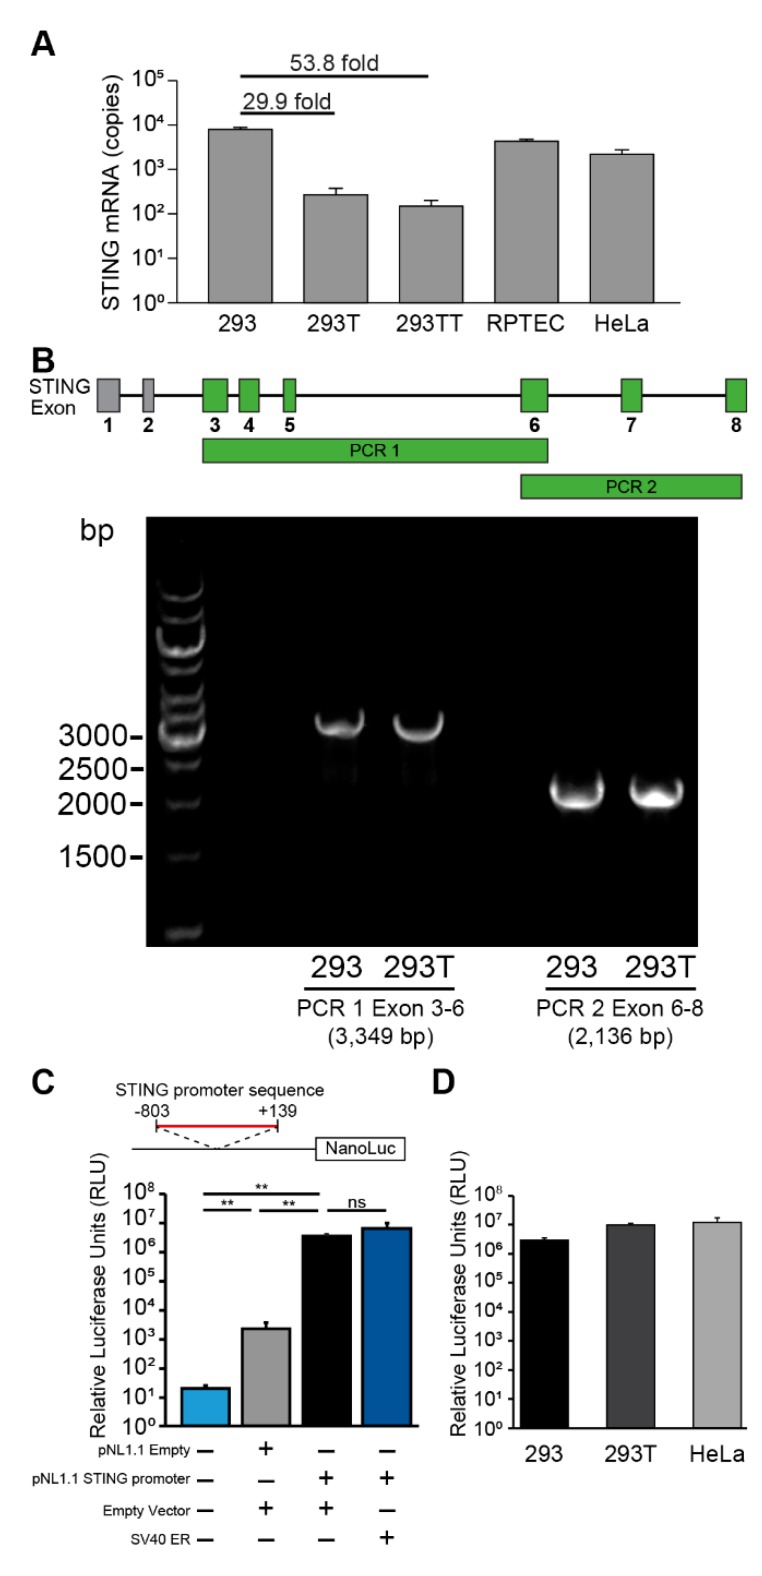
STING transcription is repressed in 293T cells but not in parental 293 cells. (A) Quantitative reverse transcription PCR (qRT-PCR) analysis of STING mRNA from the indicated human cell lines is shown. STING mRNA copy numbers were normalized to copies of GAPDH. Absolute copy numbers were determined using validated standard curves. (B) The diagram shows the STING coding region and exons 3–8 that encode for the canonical STING protein are highlighted in green. PCR amplification of the STING exons 3–6 (PCR 1, 3349 bp) and exons 6–8 (PCR2, 2136 bp) are indicated. PCR was performed on genomic DNA extracted from 293 and 293T cells. PCR products were separated by electrophoresis on a 0.8% agarose gel. Gel image is representative of three independent experiments. PCR products were cloned into a TOPO vector and Sanger sequenced. (C) Luciferase activity of STING promoter-driven luciferase reporter plasmid (90 ng) or the promoterless luciferase control plasmid (100 ng pNL1.1) co-transfected in 293 cells with 100 ng empty LPCX vector or SV40 ER plasmid. The diagram shows the STING promoter sequence cloned upstream of the NanoLuc reporter (Student’s t-test; **, P < 0.01; ns, not significant). NanoLuc luciferase activity was normalized to control TK firefly luciferase activity (TK promoter pGL4.54[luc2/TK] 10 ng). (D) Luciferase activity of STING promoter-driven luciferase reporter plasmid (90 ng) in indicated cell lines. Error bars indicate standard deviations from three replicates. These data are representative of at least three independent experiments.

