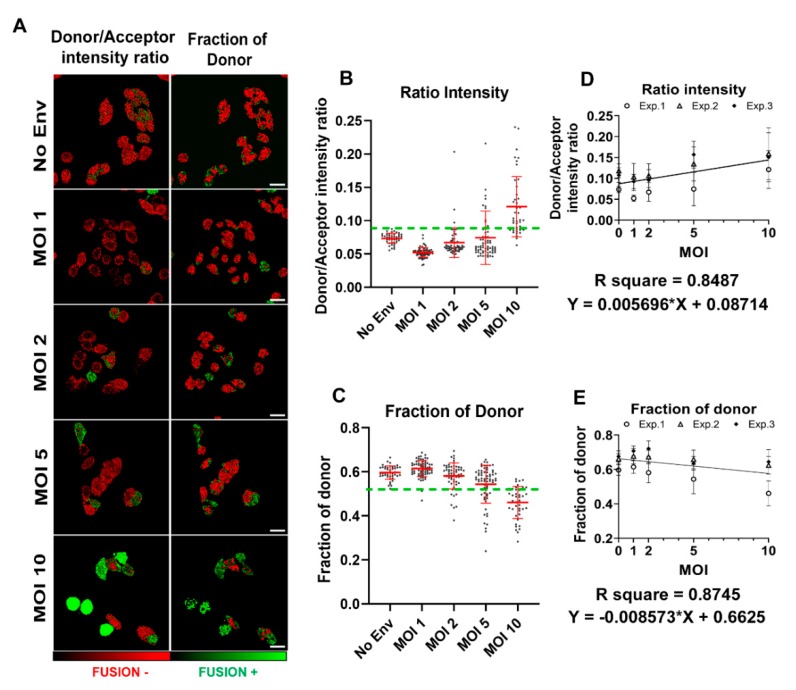
Figure 2.
BlaM HIV-1 fusion calibration utilizing intensity-based FRET approaches and FRET-FLIM. (A) Images of the BlaM assay in TZM-bl cells exposed to different MOIs (1, 2, 5 and 10) of HIV-1JFRL virions, analyzed using FRET intensity ratio and the fraction of interacting donor (fD). Images are pseudocolored in red (fusion negative) and green (fusion positive). Scale bars are 20 µm. The statistics coming from the two methods, (B) FRET intensity and (C) fD, are presented in which every dot represents a single cell (n > 50 cells per condition from one experiment). The green dotted line represents the threshold taken from TZM-bl cells exposed to HIV-1 without spikes (No Env) virions. (D,E) The calibration curves for both methods are presented together with the linear regression and equation/s. The calibration curves were obtained from the data points of three independent experiment (Exp. 1–3). Each symbol represents the mean and SD per condition, per experiment.

