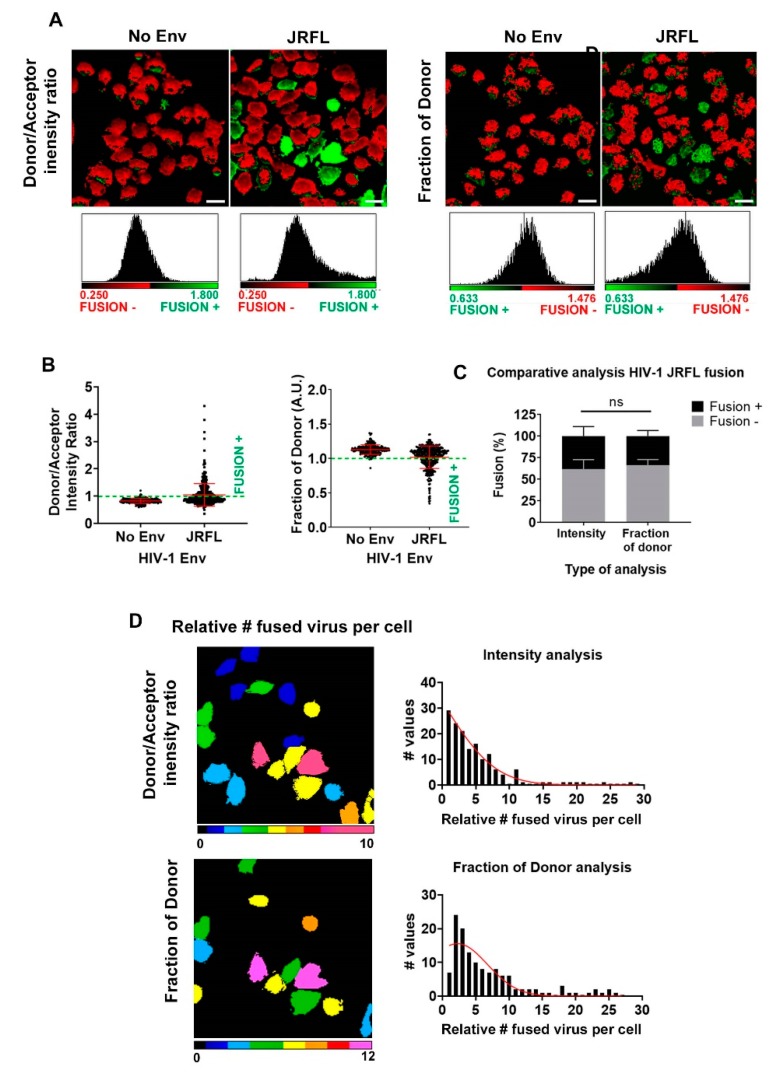
Figure 3.
BlaM HIV-1 fusion quantification per cell in TZM-bl cells. (A) Micrographs for a population of TZM-bl cells exposed to HIV-1JFRL virions (MOI = 5) and their corresponding pixel-by-pixel histograms are also presented for FRET-intensity-based and fD methods. The images are pseudocolored (red, fusion negative; green, fusion positive). In all cases, No Env HIV-1 virions were employed as a negative control and the CCF2-AM basal cleavage utilized as a reference for negative fusion. Scale bars are 20 µm. (B) The normalized statistics from three independent experiments for a population of cells with single cell accuracy are presented for the methods outlined above; n = 50–150 cells for each condition, for each experiment. Error bars are the standard deviation (SD) of the mean. (C) The overall percentage of fusion for a population of TZM-bl cells exposed to HIV-1JFRL virions (MOI = 5) is presented for both methods. An average of ~25% was found in both cases. Error bars represent the SD of the mean from the three independent experiments. (D) Using calibration curves from Figure 2D,E, the relative amount of internalized HIV-1JFRL virions per cell was obtained, again with single cell accuracy. Images are pseudocolored (cold colors represent relatively low amounts of internalized viral particles and warm colors, relatively high amounts of internalized particles). The frequency plots per cell are plotted for each approach (right column).

