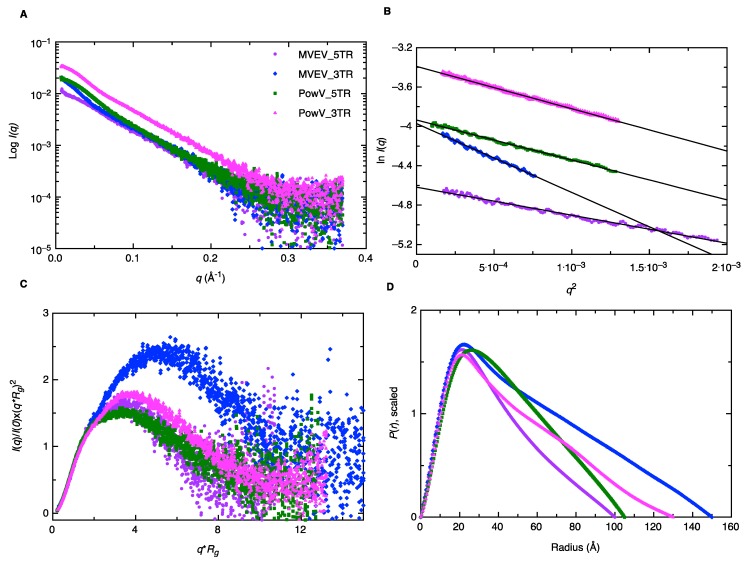
Figure 3.
Characterization of MVEV and PowV terminal regions using small-angle X-ray scattering (SAXS). (A) A plot of scattering intensity (Log I(q)) versus scattering angle (q = 4πsinθ/λ) representing merged SAXS data for MVEV and PowV. (B) Guinier plots (plot of ln(I(q)) versus q2) representing the homogeneity of samples and allowing determination of Rg based on the low-angle region data. (C) Dimensionless Kratky plots (I(q)/I(0)*(q*Rg)2 vs q*Rg) for all four RNA samples demonstrating their extended structures. (D) Pair-distance distribution (P(r)) plots for all four RNA samples representing their maximal particle dimensions and allowing the determination of Rg from the entire SAXS dataset.

