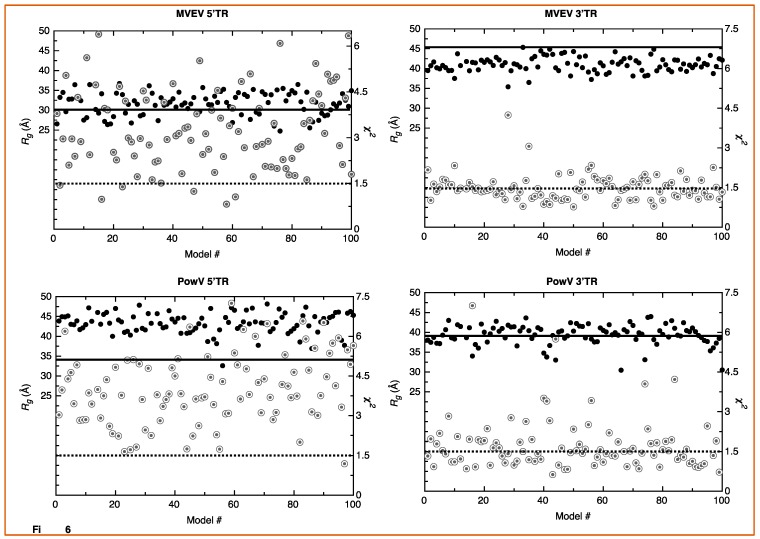
Figure 5.
Screening of high-resolution structures calculated using MC-Sym [52] for MVEV 5’ TR, MVEV 3’TR, PowV 5’TR and PowV 3’TR. For each RNA, the x-axis represents model numbers (total 100 models), whereas the y1-axis (solid black circles) and y2-axis (grey double circles) represent Rg (Å) and χ2 values, respectively, calculated using CRYSOL package [53]. For each plot, the solid dark line corresponds to y1-axis and represents the value for experimentally determined Rg (Å) as presented in Table 1. The dotted line corresponds to y2-axis and represents a χ2 value of 1.5. These plots indicate that MC-Sym derived structures represent a wide-range of conformations these RNAs can theoretically adapt.

