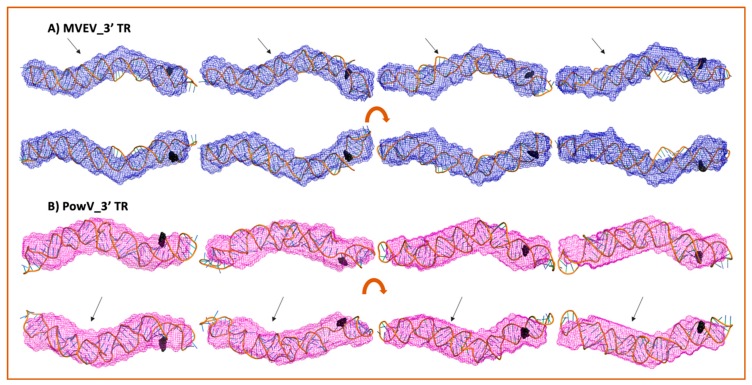
Figure 7.
High-resolution structures calculated using MC-SYM overlaid with low-resolution SAXS models. A) MVEV 3TR and B) PowV 3TR. Bottom panels in both cases represent an 180o rotation along the x-axis represented in the top panels. Black spheres represent 5’ terminal region on each construct. The arrows represent stem-loop I (SLI) location in 3’ TRs.

