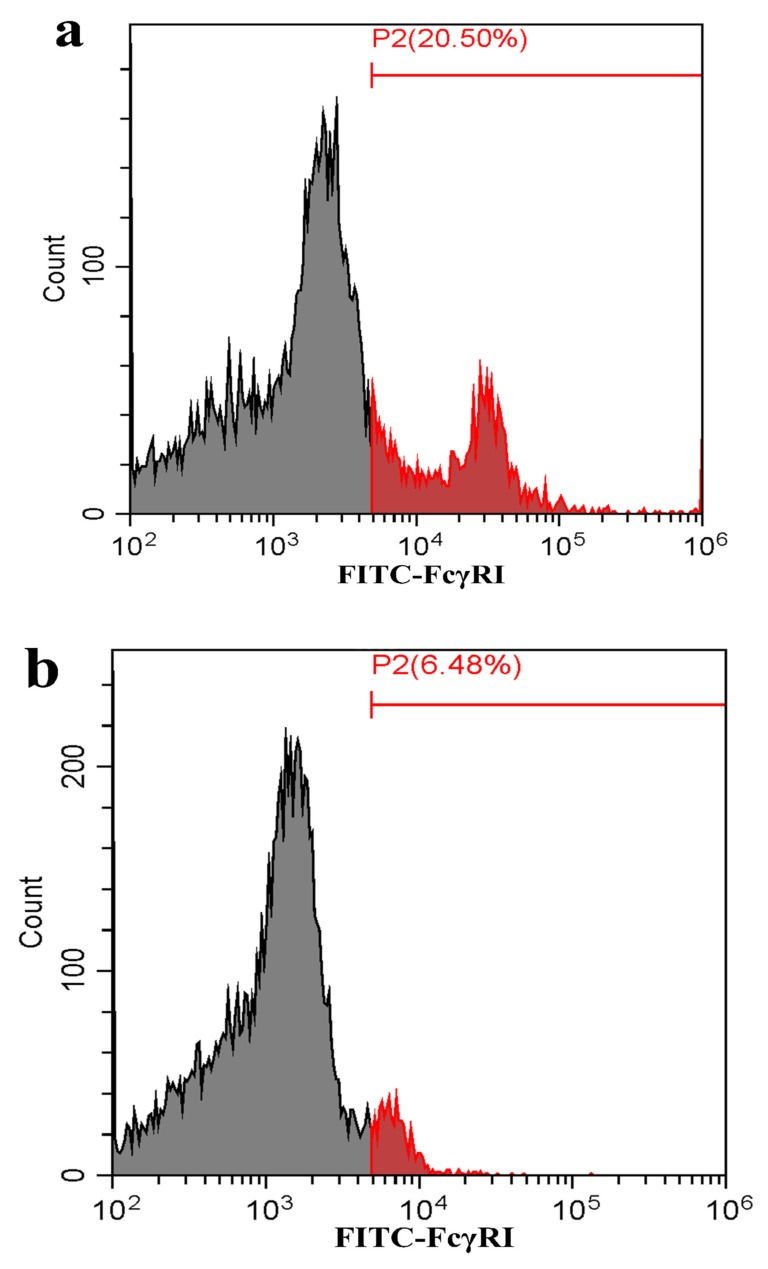
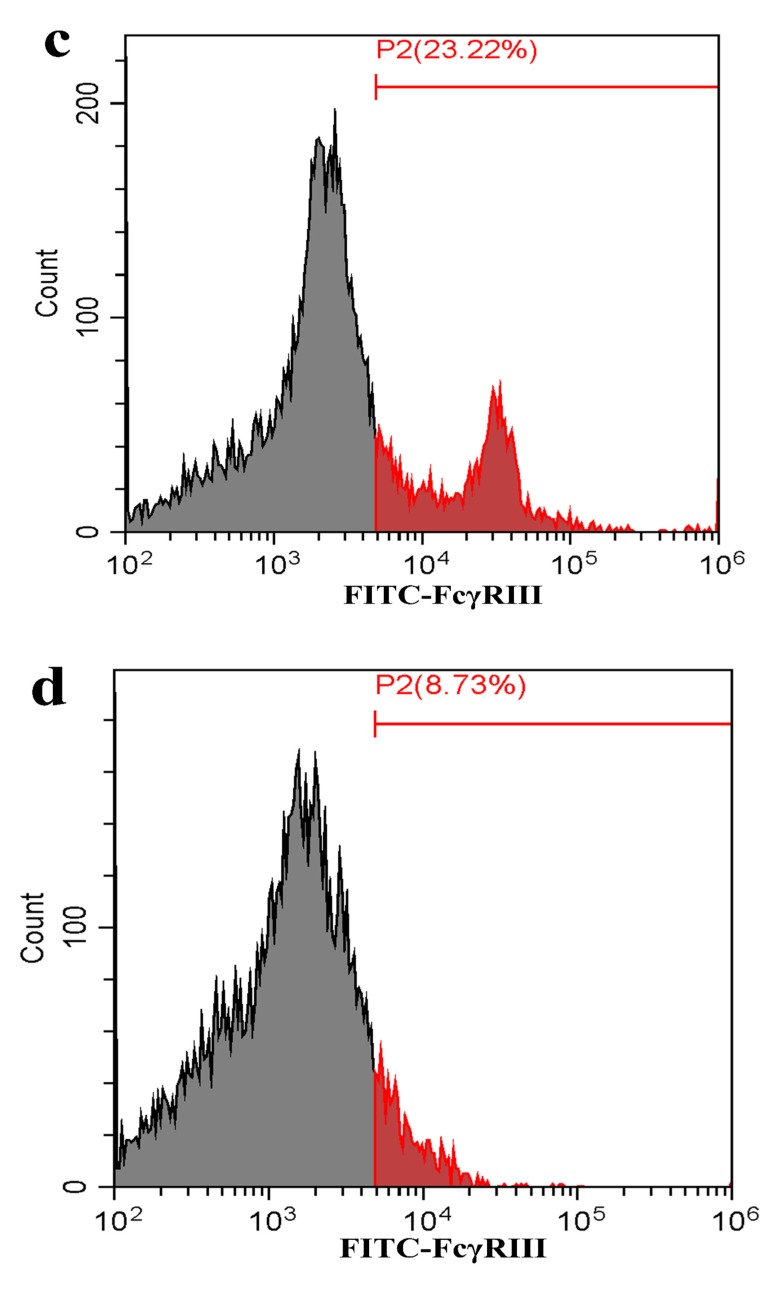
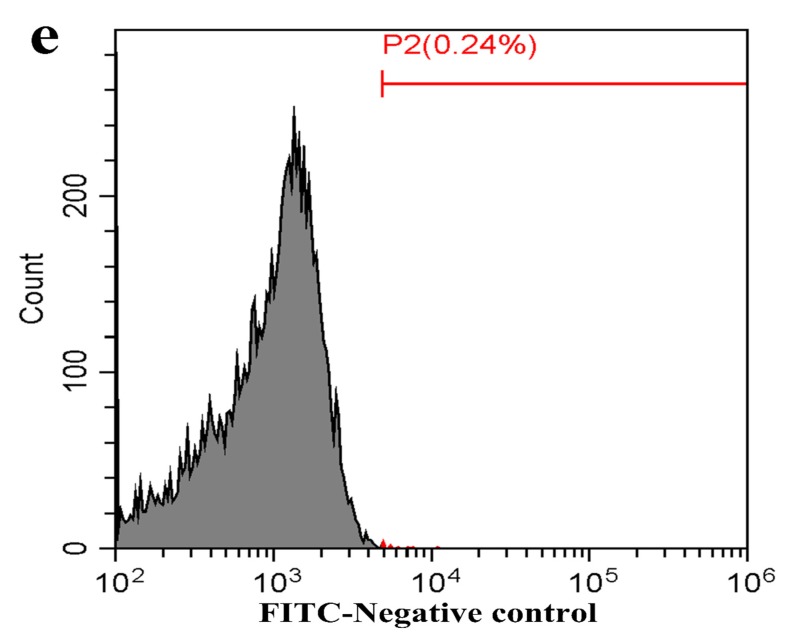
Figure 7.
Flow cytometry analysis of FcγRI or FcγRIII on the surface of porcine AMs. The cells were transfected with FcγRI siRNA, FcγRIII siRNA or negative siRNA for 48 h. (a) Representative histograms of the percentage of negative siRNA-transfected cells surface-stained with anti-FcγRI IgG and FITC-conjugated goat anti-rabbit IgG. (b) Representative histograms of the percentage of FcγRI siRNA-transfected cells surface-stained with anti-FcγRI IgG and FITC-conjugated goat anti-rabbit IgG. (c) Representative histograms of the percentage of negative siRNA-transfected cells surface-stained with anti-FcγRIII IgG and FITC-conjugated goat anti-rabbit IgG. (d) Representative histograms of the percentage of FcγRIII siRNA-transfected cells surface-stained with anti-FcγRIII IgG and FITC-conjugated goat anti-rabbit IgG. (e) Representative histograms of the percentage of mock cells surface-stained with RNI and FITC-conjugated goat anti-rabbit IgG. Note: siRNA: small interfering RNA; FcγRI: Fc gamma receptor I; FcγRIII: Fc gamma receptor III; FITC: fluorescein isothiocyanate; RNI: rabbit-negative IgG.


